## Chart: ALFWorld Success Rate
### Overview
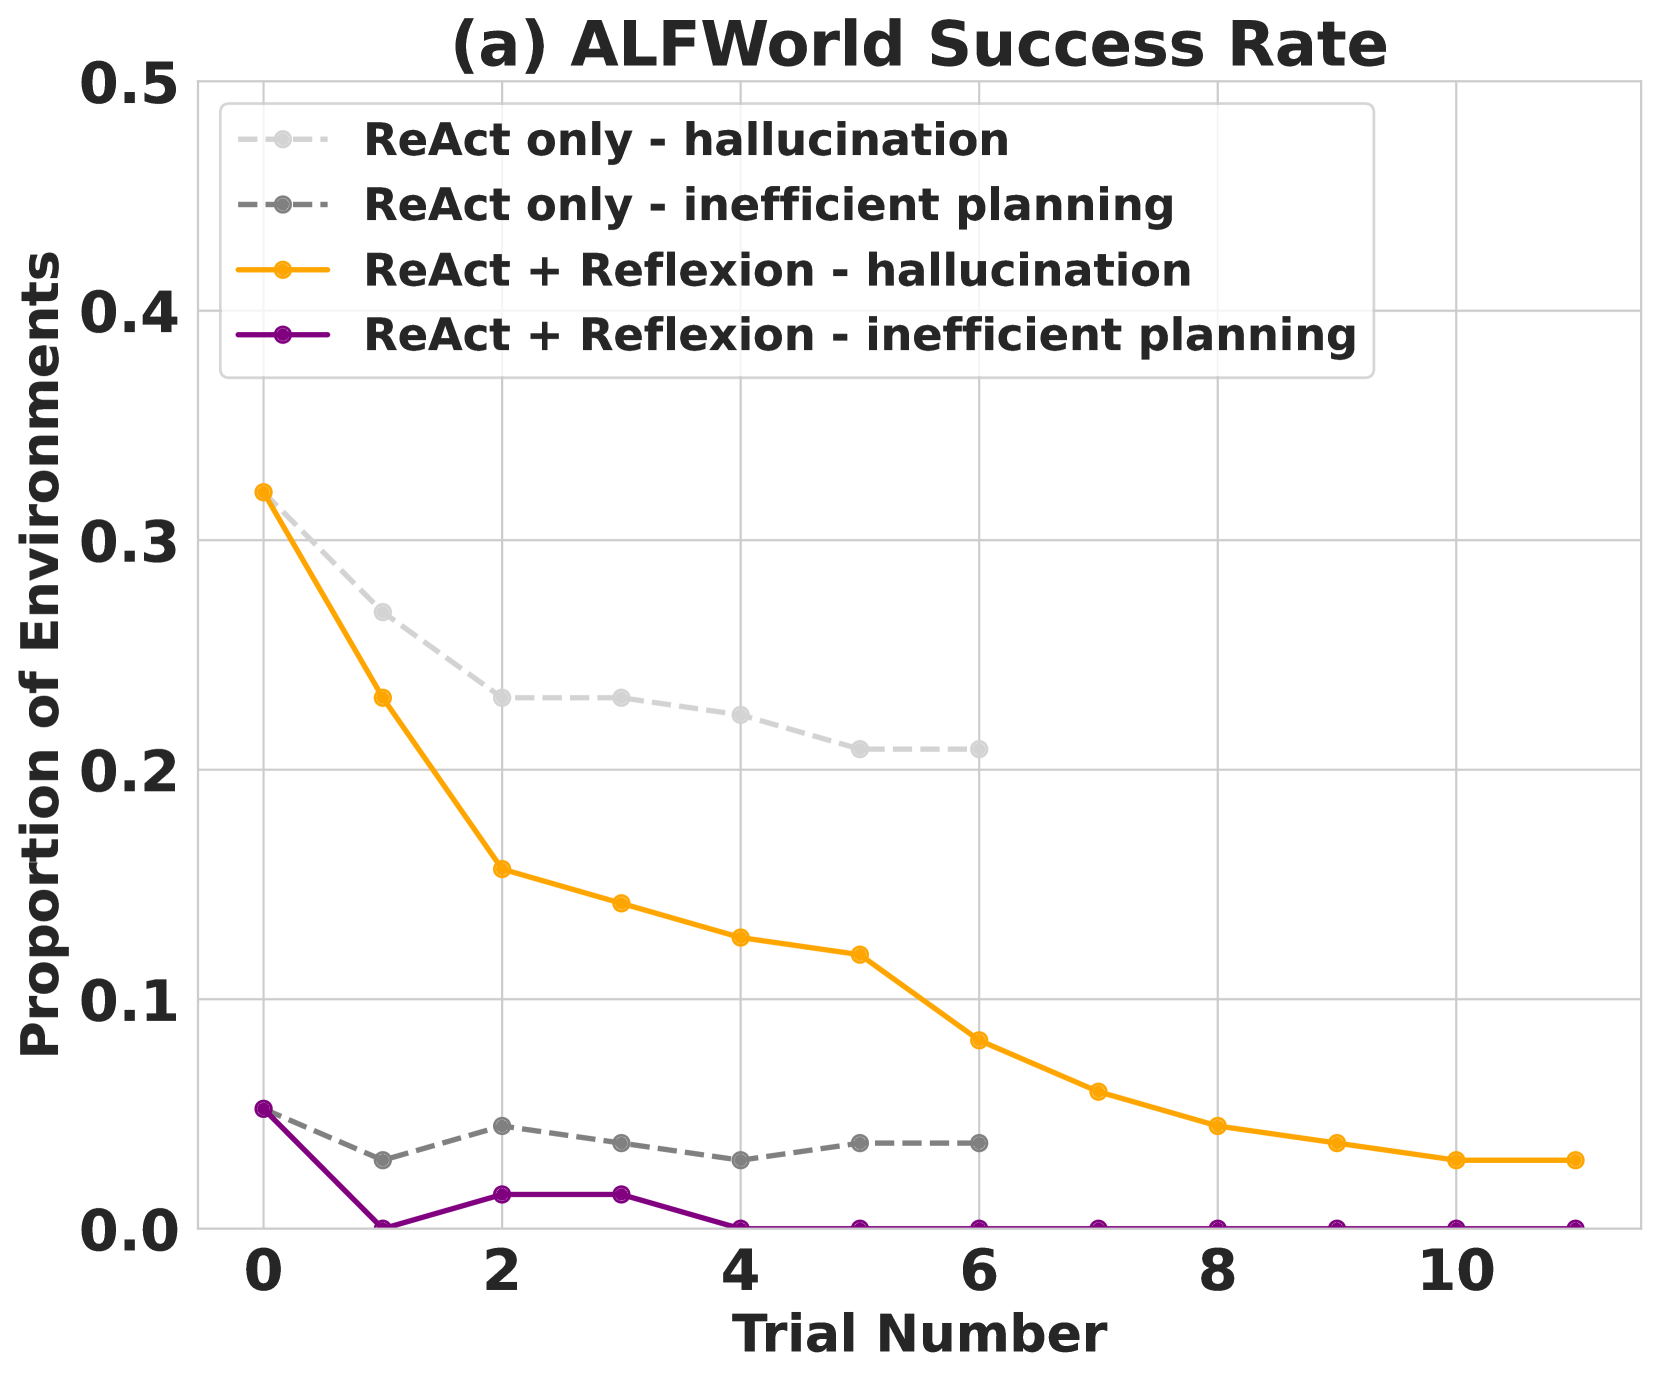
The image is a line chart comparing the success rate of different agents in ALFWorld environments over a series of trials. The chart plots the "Proportion of Environments" (success rate) on the y-axis against the "Trial Number" on the x-axis. Four different agent configurations are compared: "ReAct only - hallucination", "ReAct only - inefficient planning", "ReAct + Reflexion - hallucination", and "ReAct + Reflexion - inefficient planning".
### Components/Axes
* **Title:** (a) ALFWorld Success Rate
* **X-axis:**
* **Label:** Trial Number
* **Scale:** 0 to 10, with integer increments (0, 2, 4, 6, 8, 10)
* **Y-axis:**
* **Label:** Proportion of Environments
* **Scale:** 0.0 to 0.5, with increments of 0.1 (0.0, 0.1, 0.2, 0.3, 0.4, 0.5)
* **Legend (Top-Right):**
* **Light Gray Dashed Line:** ReAct only - hallucination
* **Dark Gray Dashed Line:** ReAct only - inefficient planning
* **Orange Line:** ReAct + Reflexion - hallucination
* **Purple Line:** ReAct + Reflexion - inefficient planning
### Detailed Analysis
* **ReAct only - hallucination (Light Gray Dashed Line):**
* Trend: Decreases sharply initially, then plateaus.
* Data Points:
* Trial 0: ~0.32
* Trial 2: ~0.23
* Trial 4: ~0.22
* Trial 6: ~0.21
* Trial 11: ~0.21
* **ReAct only - inefficient planning (Dark Gray Dashed Line):**
* Trend: Starts low, increases slightly, then plateaus.
* Data Points:
* Trial 0: ~0.05
* Trial 2: ~0.05
* Trial 4: ~0.03
* Trial 6: ~0.04
* Trial 11: ~0.03
* **ReAct + Reflexion - hallucination (Orange Line):**
* Trend: Decreases steadily.
* Data Points:
* Trial 0: ~0.32
* Trial 2: ~0.20
* Trial 4: ~0.13
* Trial 6: ~0.08
* Trial 8: ~0.04
* Trial 11: ~0.03
* **ReAct + Reflexion - inefficient planning (Purple Line):**
* Trend: Remains very low, near zero.
* Data Points:
* Trial 0: ~0.05
* Trial 2: ~0.00
* Trial 4: ~0.00
* Trial 6: ~0.00
* Trial 11: ~0.00
### Key Observations
* The "ReAct only - hallucination" agent starts with a relatively high success rate but quickly declines and plateaus.
* The "ReAct only - inefficient planning" agent has a consistently low success rate.
* The "ReAct + Reflexion - hallucination" agent shows a steady decline in success rate over trials.
* The "ReAct + Reflexion - inefficient planning" agent has the lowest success rate, remaining near zero throughout the trials.
### Interpretation
The data suggests that adding "Reflexion" to the "ReAct" agent significantly improves performance when dealing with "inefficient planning" issues, as the purple line ("ReAct + Reflexion - inefficient planning") is consistently near zero. However, when the issue is "hallucination," adding "Reflexion" (orange line) does not prevent a decline in success rate, although it starts at a similar level to "ReAct only - hallucination" (light gray dashed line). The "ReAct only - inefficient planning" agent performs poorly, indicating that "ReAct" alone is insufficient to address this problem. The initial high success rate of "ReAct only - hallucination" suggests it can initially handle the environment, but its performance degrades over time, possibly due to accumulating errors or inability to adapt.