# Technical Document Extraction: ALFWorld Success Rate Analysis
## 1. Header Information
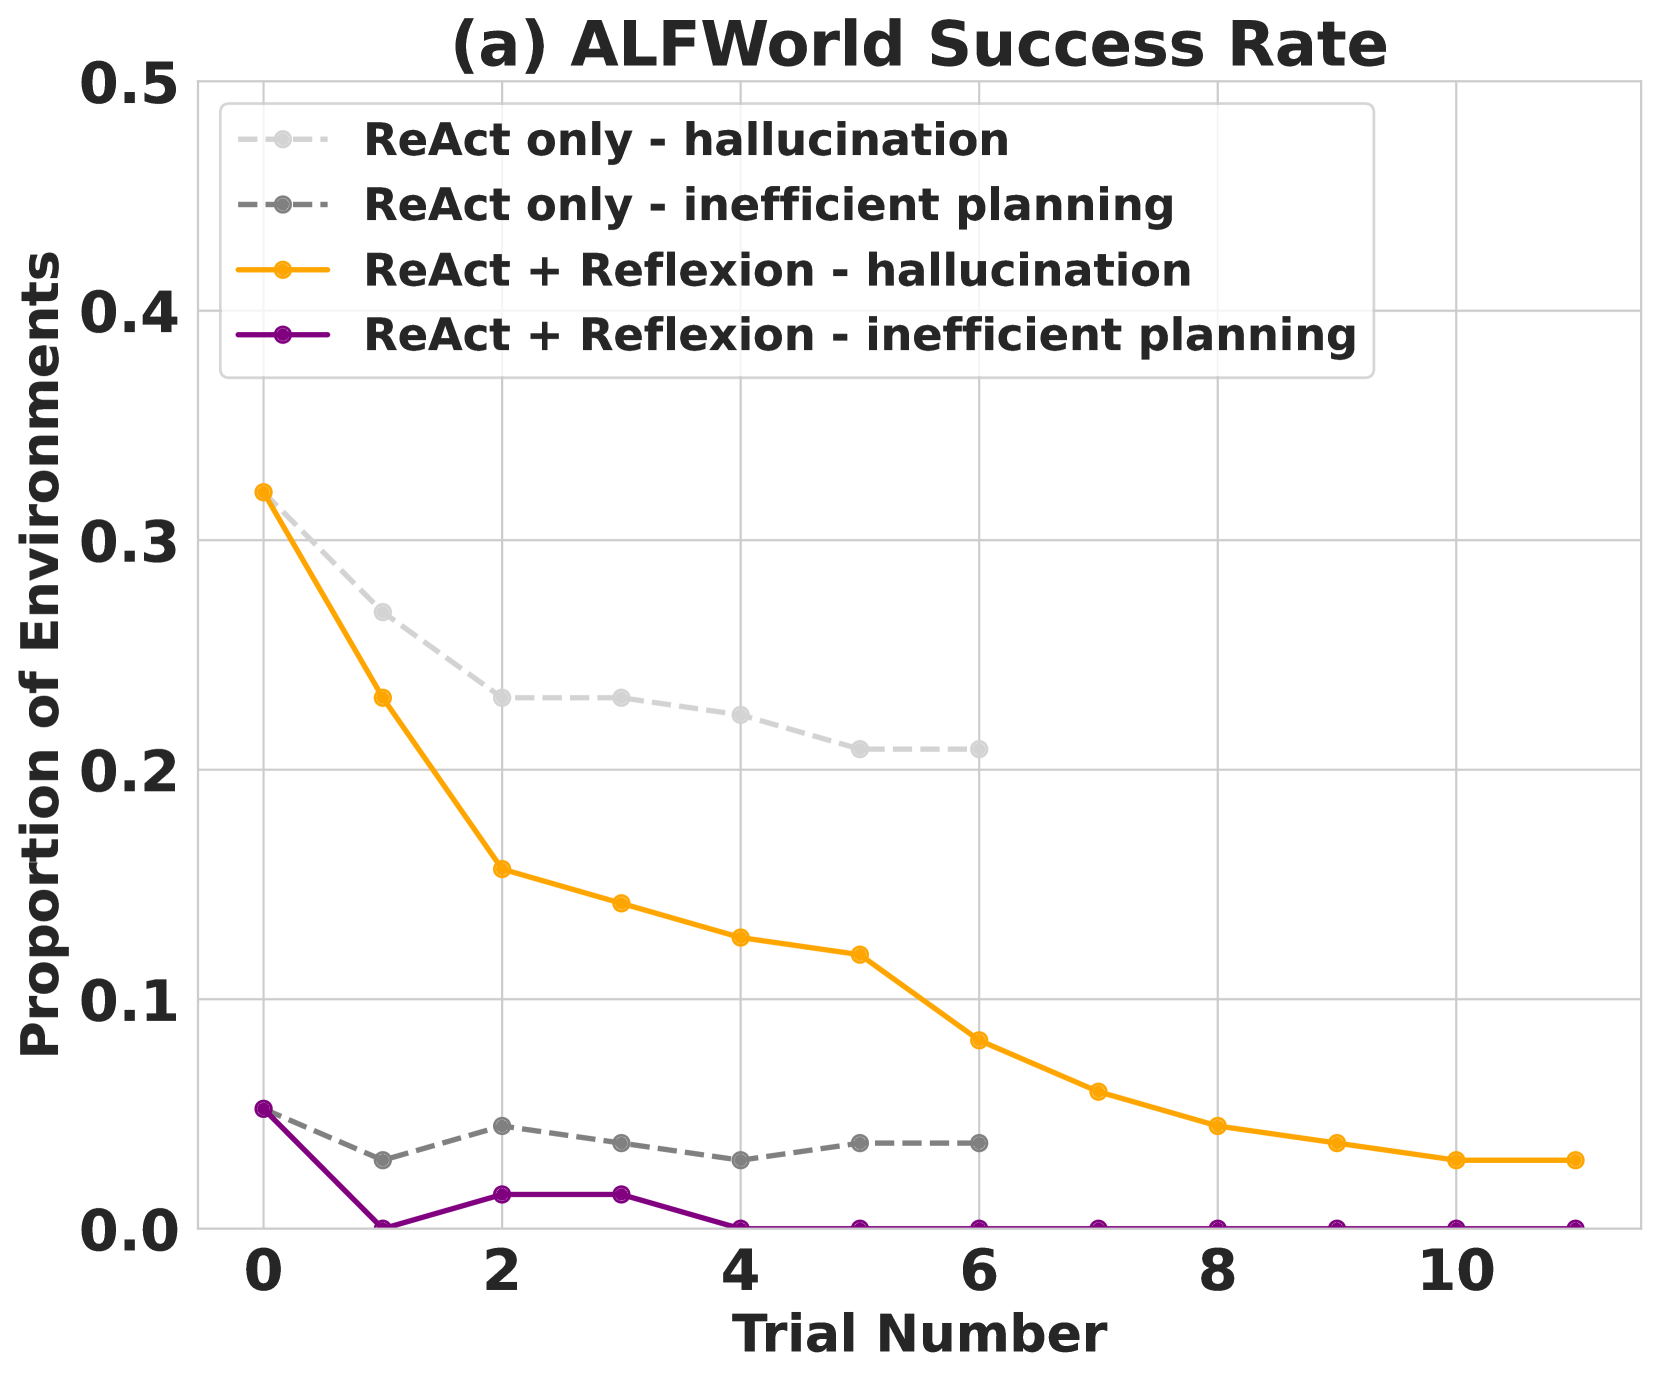
* **Title:** (a) ALFWorld Success Rate
* **Image Type:** Line Graph with markers.
## 2. Axis Definitions
* **Y-Axis (Vertical):**
* **Label:** Proportion of Environments
* **Scale:** 0.0 to 0.5
* **Markers:** 0.0, 0.1, 0.2, 0.3, 0.4, 0.5
* **X-Axis (Horizontal):**
* **Label:** Trial Number
* **Scale:** 0 to 11
* **Markers:** 0, 2, 4, 6, 8, 10
## 3. Legend Information
The legend is located in the top-left quadrant of the chart area.
* **Light Gray, Dashed Line with Circles:** ReAct only - hallucination
* **Dark Gray, Dashed Line with Circles:** ReAct only - inefficient planning
* **Orange, Solid Line with Circles:** ReAct + Reflexion - hallucination
* **Purple, Solid Line with Circles:** ReAct + Reflexion - inefficient planning
## 4. Data Series Analysis and Trends
### Series 1: ReAct only - hallucination (Light Gray, Dashed)
* **Trend:** Slopes downward steadily from Trial 0 to Trial 5, then plateaus.
* **Data Points (Approximate):**
* Trial 0: ~0.32
* Trial 1: ~0.27
* Trial 2: ~0.23
* Trial 3: ~0.23
* Trial 4: ~0.22
* Trial 5: ~0.21
* Trial 6: ~0.21 (End of series)
### Series 2: ReAct only - inefficient planning (Dark Gray, Dashed)
* **Trend:** Remains relatively flat at a low value, with minor fluctuations.
* **Data Points (Approximate):**
* Trial 0: ~0.05
* Trial 1: ~0.03
* Trial 2: ~0.045
* Trial 3: ~0.038
* Trial 4: ~0.03
* Trial 5: ~0.038
* Trial 6: ~0.038 (End of series)
### Series 3: ReAct + Reflexion - hallucination (Orange, Solid)
* **Trend:** Sharp downward slope from Trial 0 to Trial 10, showing significant reduction in the proportion of environments over time.
* **Data Points (Approximate):**
* Trial 0: ~0.32
* Trial 1: ~0.23
* Trial 2: ~0.16
* Trial 3: ~0.14
* Trial 4: ~0.13
* Trial 5: ~0.12
* Trial 6: ~0.08
* Trial 7: ~0.06
* Trial 8: ~0.045
* Trial 9: ~0.038
* Trial 10: ~0.03
* Trial 11: ~0.03
### Series 4: ReAct + Reflexion - inefficient planning (Purple, Solid)
* **Trend:** Starts low and drops to zero (or near-zero) by Trial 4, remaining at the baseline for the duration of the trials.
* **Data Points (Approximate):**
* Trial 0: ~0.05
* Trial 1: ~0.00
* Trial 2: ~0.015
* Trial 3: ~0.015
* Trial 4 - 11: 0.00
## 5. Key Observations
* **Initial State:** At Trial 0, both "ReAct only" and "ReAct + Reflexion" start with the same proportion of hallucinations (~0.32) and inefficient planning (~0.05).
* **Reflexion Impact:** The addition of "Reflexion" significantly reduces both hallucination and inefficient planning over successive trials compared to the "ReAct only" baseline.
* **Hallucination vs. Planning:** Hallucination is the primary failure mode across all trials, as its proportion is consistently higher than inefficient planning.
* **Convergence:** The "ReAct + Reflexion - inefficient planning" series reaches a success state (0.0 proportion of failure) much faster than the hallucination series.