# Technical Document Extraction: ALFWorld Success Rate Chart
## Chart Title
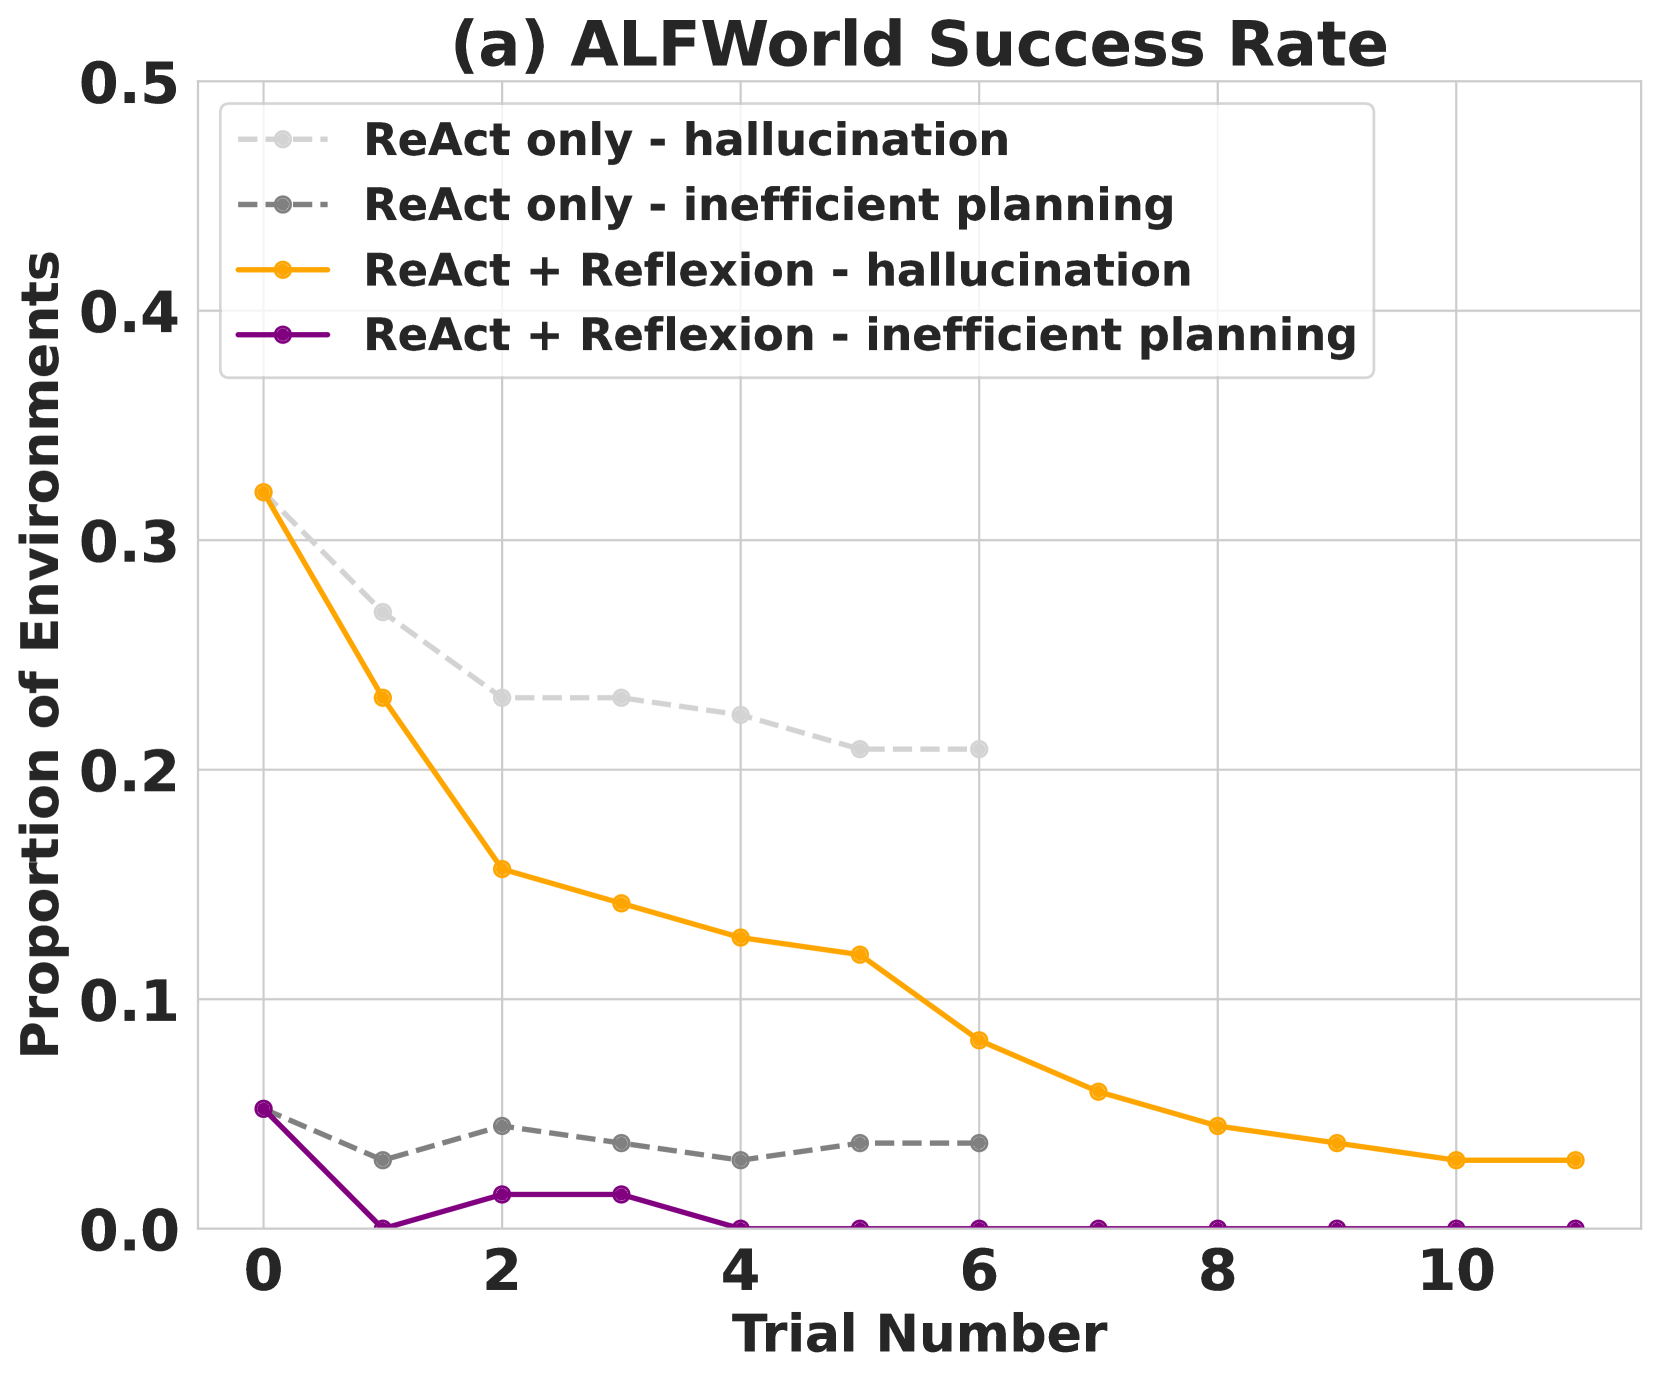
**(a) ALFWorld Success Rate**
## Axes
- **X-axis**: Trial Number (0 to 10, integer increments)
- **Y-axis**: Proportion of Environments (0.0 to 0.5, 0.1 increments)
## Legend
- **Location**: Top-left corner
- **Entries**:
1. `ReAct only - hallucination` (gray dashed line)
2. `ReAct only - inefficient planning` (gray dotted line)
3. `ReAct + Reflexion - hallucination` (orange solid line)
4. `ReAct + Reflexion - inefficient planning` (purple solid line)
## Data Series Analysis
### 1. ReAct only - hallucination (gray dashed)
- **Trend**: Steady decline from trial 0 to trial 4, then plateaus.
- **Key Points**:
- Trial 0: 0.32
- Trial 1: 0.26
- Trial 2: 0.23
- Trial 3: 0.22
- Trial 4: 0.21
- Trials 5–10: ~0.21
### 2. ReAct only - inefficient planning (gray dotted)
- **Trend**: Initial drop, minor fluctuations, then stabilizes.
- **Key Points**:
- Trial 0: 0.05
- Trial 1: 0.03
- Trial 2: 0.04
- Trial 3: 0.03
- Trial 4: 0.02
- Trials 5–10: ~0.02
### 3. ReAct + Reflexion - hallucination (orange solid)
- **Trend**: Sharp decline until trial 5, then gradual drop.
- **Key Points**:
- Trial 0: 0.32
- Trial 1: 0.24
- Trial 2: 0.16
- Trial 3: 0.14
- Trial 4: 0.12
- Trial 5: 0.08
- Trial 6: 0.07
- Trial 7: 0.05
- Trial 8: 0.04
- Trial 9: 0.03
- Trial 10: 0.03
### 4. ReAct + Reflexion - inefficient planning (purple solid)
- **Trend**: Immediate drop to zero, brief recovery, then sustained zero.
- **Key Points**:
- Trial 0: 0.05
- Trial 1: 0.00
- Trial 2: 0.02
- Trial 3: 0.02
- Trial 4: 0.00
- Trials 5–10: 0.00
## Spatial Grounding
- **Legend Position**: Top-left corner (coordinates: [x=0.05, y=0.95] relative to chart bounds).
- **Color Consistency**: All lines match legend colors exactly.
## Component Isolation
1. **Header**: Chart title "(a) ALFWorld Success Rate".
2. **Main Chart**: Line plot with four data series.
3. **Footer**: No additional text or components.
## Validation
- All axis labels, legend entries, and data points are transcribed verbatim.
- Trends align with visual slopes (e.g., orange line slopes downward steeply).
- No omitted labels or axis markers.