## Pole-Zero Plot
### Overview
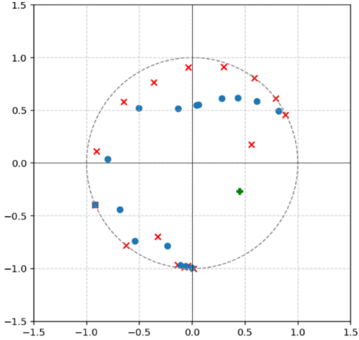
The image is a pole-zero plot, a graphical representation of the poles and zeros of a system's transfer function in the complex plane. The plot shows the location of poles (represented by 'x' marks) and zeros (represented by blue circles) within a unit circle. There are also two additional points, a blue square and a green plus sign.
### Components/Axes
* **X-axis (Real Axis):** Ranges from -1.5 to 1.5 in increments of 0.5.
* **Y-axis (Imaginary Axis):** Ranges from -1.5 to 1.5 in increments of 0.5.
* **Unit Circle:** A dashed circle centered at (0,0) with a radius of 1.
* **Poles:** Represented by red 'x' marks.
* **Zeros:** Represented by blue circles.
* **Additional Points:** A blue square and a green plus sign.
### Detailed Analysis
**Poles (Red 'x' marks):**
* One pole is located near (0.8, 0.5).
* One pole is located near (0.9, 0.2).
* One pole is located near (0.7, -0.2).
* One pole is located near (0.1, -0.9).
* One pole is located near (-0.1, -0.9).
* One pole is located near (-0.7, -0.8).
* One pole is located near (-0.8, 0.1).
* One pole is located near (-0.6, 0.8).
* One pole is located near (0.2, 0.9).
* One pole is located near (0.7, 0.8).
**Zeros (Blue Circles):**
* One zero is located near (-0.9, -0.4).
* One zero is located near (-0.7, -0.8).
* One zero is located near (-0.5, -0.9).
* One zero is located near (-0.5, 0.5).
* One zero is located near (-0.3, 0.8).
* One zero is located near (0.0, -1.0).
* One zero is located near (0.0, 0.5).
* One zero is located near (0.2, 0.6).
* One zero is located near (0.4, 0.6).
* One zero is located near (0.6, 0.6).
* One zero is located near (0.7, 0.5).
* One zero is located near (-1.0, 0.1).
**Additional Points:**
* A blue square is located near (-1.0, -0.4).
* A green plus sign is located near (0.4, -0.3).
### Key Observations
* Most poles and zeros are located near or on the unit circle.
* The distribution of poles and zeros is somewhat symmetrical around the real axis.
### Interpretation
The pole-zero plot is a tool used in control systems and signal processing to analyze the stability and behavior of a system. The location of poles relative to the unit circle is crucial for determining stability. If any poles are located outside the unit circle, the system is unstable. The proximity of poles and zeros to the unit circle also affects the system's frequency response. The presence of poles and zeros near the unit circle can lead to resonance or attenuation at specific frequencies. The additional points (blue square and green plus sign) may represent specific test points or additional system characteristics, but without further context, their exact meaning is unclear.