## Heatmap: Attention Weight Distribution After Parameter Modifications
### Overview
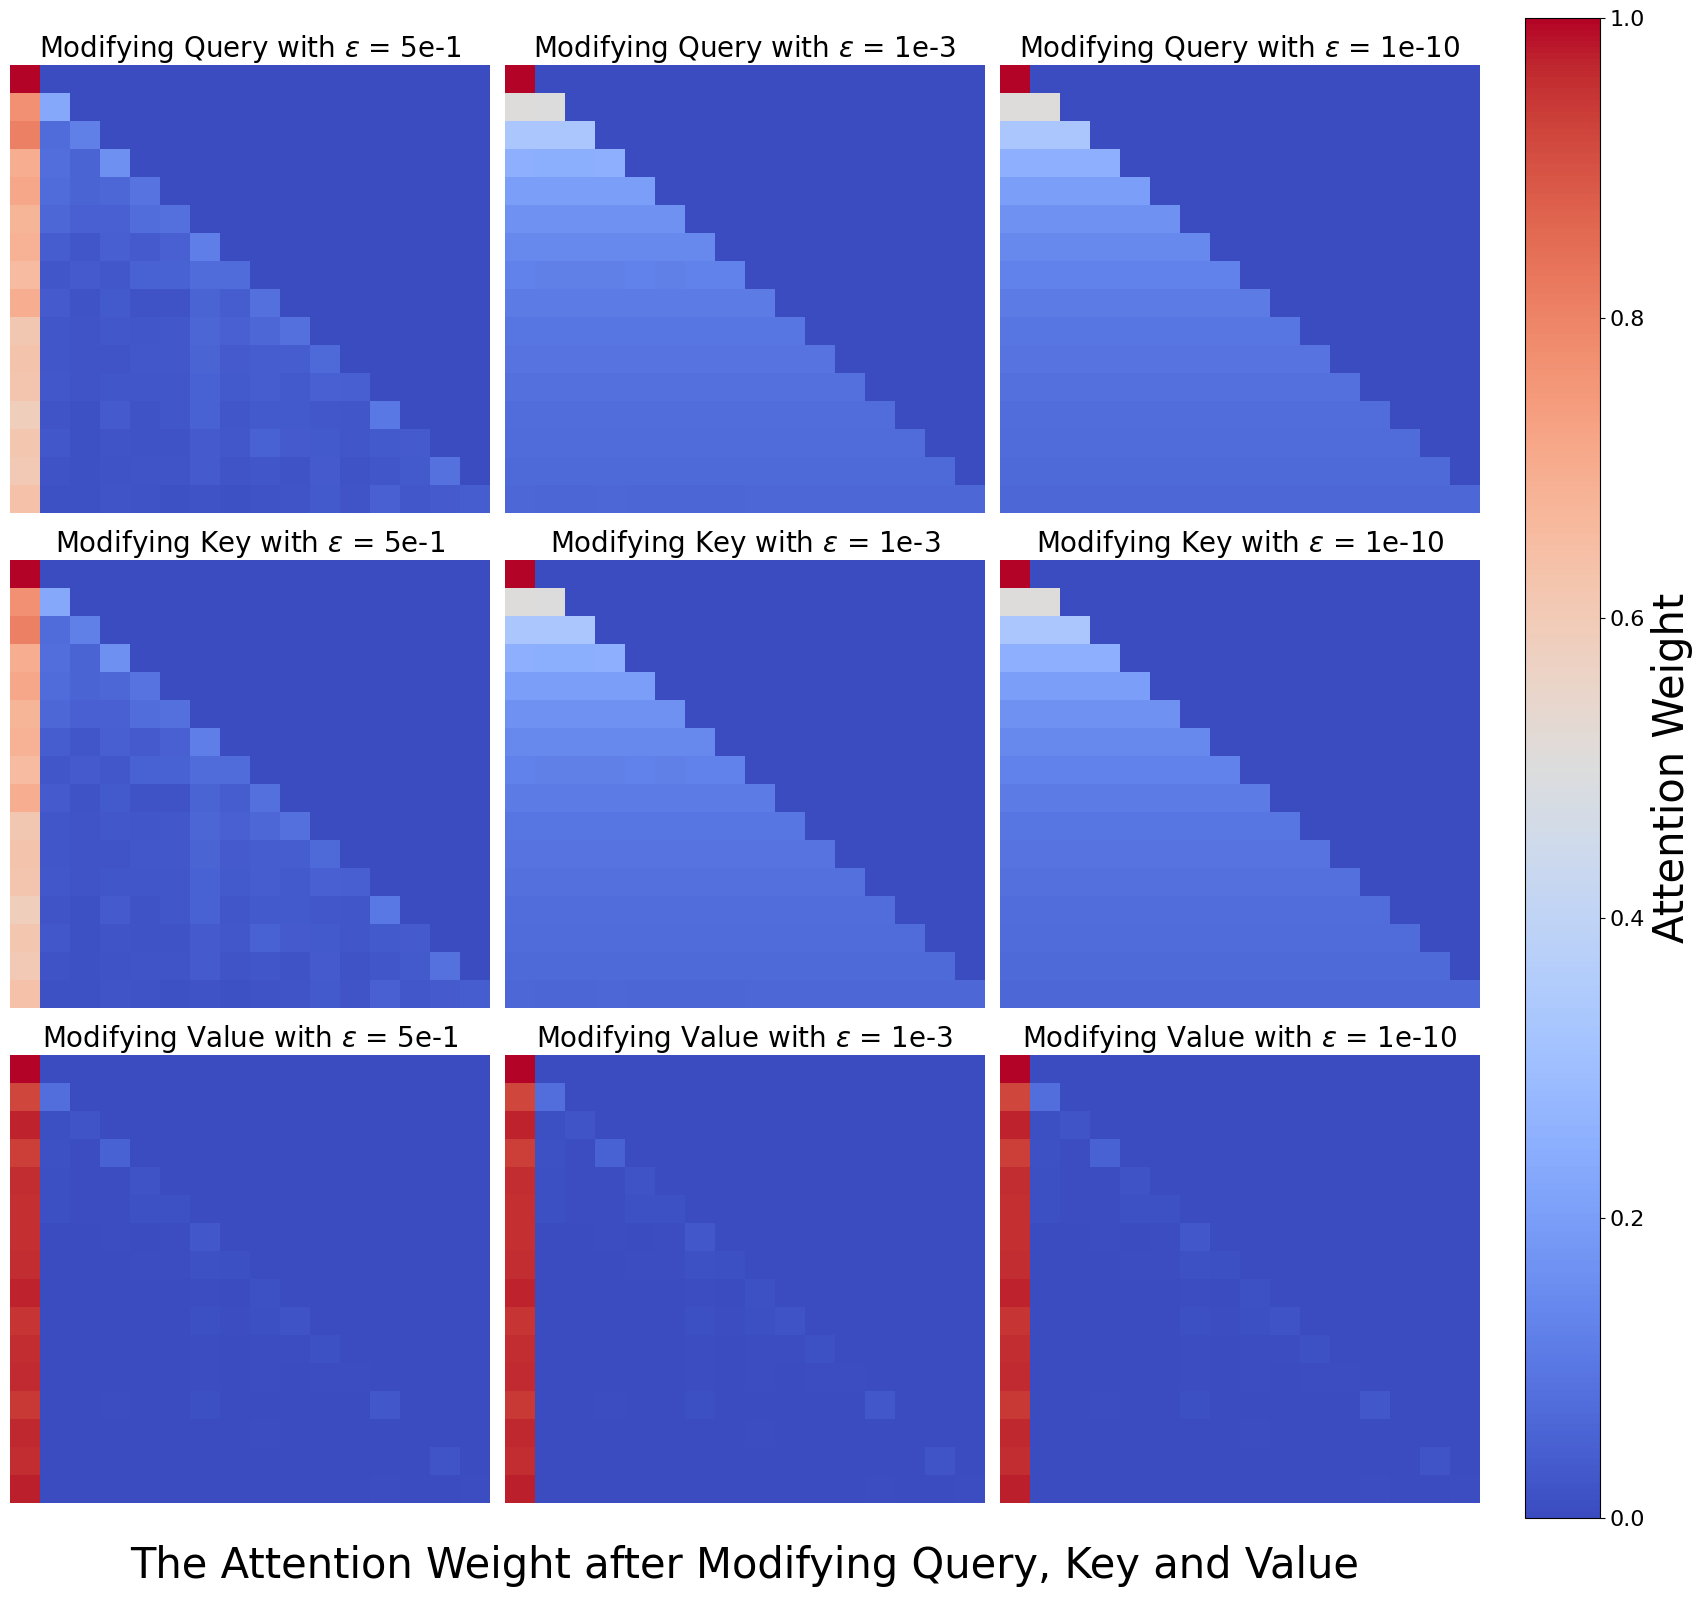
The image presents a 3x3 grid of heatmaps visualizing attention weight distributions in a neural network model after modifying three components (Query, Key, Value) with three different perturbation magnitudes (ε = 5e-1, 1e-3, 1e-10). Each panel shows spatial patterns of attention weights using a red-to-blue color gradient, with red indicating higher weights (1.0) and blue indicating lower weights (0.0).
### Components/Axes
1. **Panel Titles** (Top of each heatmap):
- Row 1: "Modifying Query with ε = 5e-1", "Modifying Query with ε = 1e-3", "Modifying Query with ε = 1e-10"
- Row 2: "Modifying Key with ε = 5e-1", "Modifying Key with ε = 1e-3", "Modifying Key with ε = 1e-10"
- Row 3: "Modifying Value with ε = 5e-1", "Modifying Value with ε = 1e-3", "Modifying Value with ε = 1e-10"
2. **Color Scale** (Right side):
- Vertical gradient from red (1.0) to blue (0.0)
- Label: "Attention Weight"
3. **X-Axis** (Bottom of all panels):
- Label: "The Attention Weight after Modifying Query, Key and Value"
- Spatial resolution: 10x10 grid (implied by panel structure)
### Detailed Analysis
1. **Query Modifications**:
- **ε = 5e-1**: Diagonal red-to-blue gradient (smooth transition)
- **ε = 1e-3**: Sharper diagonal red peak with surrounding blue
- **ε = 1e-10**: Dominant diagonal red square (near-perfect focus)
2. **Key Modifications**:
- Similar pattern to Query but with slightly less intensity in red regions
- ε = 5e-1 shows broader red gradient than Query
3. **Value Modifications**:
- Most pronounced diagonal focus (especially at ε = 1e-10)
- ε = 5e-1 shows strongest red gradient among all panels
### Key Observations
1. **Epsilon Impact**:
- Higher ε (5e-1): Uniform distribution (smooth gradients)
- Lower ε (1e-10): Sharp diagonal focus (discrete attention)
- Intermediate ε (1e-3): Transitional pattern between uniform and focused
2. **Component Sensitivity**:
- Value modifications show strongest diagonal focus
- Query modifications exhibit most gradual transitions
- Key modifications fall between Query and Value in focus intensity
3. **Spatial Patterns**:
- All panels show diagonal dominance (positional correlation)
- Lower ε values create more pronounced diagonal red squares
- Higher ε values produce more diffuse red-to-blue gradients
### Interpretation
The data demonstrates that smaller perturbations (lower ε) enable the model to maintain sharper, more focused attention mechanisms, particularly when modifying the Value component. This suggests that parameter stability (low ε) preserves positional specificity in attention weights. Larger perturbations (high ε) introduce noise that regularizes attention distribution, causing more uniform weight allocation across positions. The consistent diagonal patterns across all panels indicate an inherent positional bias in the attention mechanism, which becomes more pronounced under stable parameter conditions. These findings have implications for understanding how parameter regularization affects model interpretability and performance in transformer architectures.