## Line Graph: Accuracy Comparison Across Iterations
### Overview
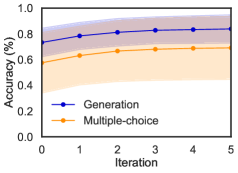
The image depicts a line graph comparing the accuracy of two methods ("Generation" and "Multiple-choice") across five iterations. The y-axis represents accuracy as a percentage (0–100%), while the x-axis represents iterations (0–5). Shaded regions around each line indicate variability or confidence intervals.
### Components/Axes
- **X-axis (Iteration)**: Labeled "Iteration" with markers at 0, 1, 2, 3, 4, and 5.
- **Y-axis (Accuracy %)**: Labeled "Accuracy (%)" with increments from 0.0 to 1.0.
- **Legend**: Located at the bottom-left corner, with:
- **Blue line**: "Generation"
- **Orange line**: "Multiple-choice"
- **Shaded Regions**: Gray for "Generation" and orange for "Multiple-choice," representing variability.
### Detailed Analysis
1. **Generation (Blue Line)**:
- **Trend**: Slopes upward steadily from iteration 0 to 5.
- **Data Points**:
- Iteration 0: ~0.75%
- Iteration 1: ~0.80%
- Iteration 2: ~0.82%
- Iteration 3: ~0.83%
- Iteration 4: ~0.85%
- **Variability**: Shaded region widens slightly between iterations 0–2, then narrows.
2. **Multiple-choice (Orange Line)**:
- **Trend**: Slopes upward gradually but less steeply than "Generation."
- **Data Points**:
- Iteration 0: ~0.60%
- Iteration 1: ~0.65%
- Iteration 2: ~0.68%
- Iteration 3: ~0.69%
- Iteration 4: ~0.70%
- **Variability**: Shaded region remains relatively consistent in width.
### Key Observations
- **Accuracy Trends**: Both methods improve over iterations, but "Generation" consistently outperforms "Multiple-choice."
- **Variability**: "Generation" shows higher variability (wider shaded regions), especially early in the iterations.
- **Convergence**: By iteration 5, "Generation" reaches ~0.85% accuracy, while "Multiple-choice" plateaus near ~0.70%.
### Interpretation
The data suggests that the "Generation" method demonstrates superior accuracy growth over iterations compared to "Multiple-choice." However, the wider confidence intervals for "Generation" imply greater uncertainty in its performance, potentially due to dynamic adjustments or stochastic elements in the method. The "Multiple-choice" method appears more stable but less effective, possibly due to fixed parameters or limited adaptability. These trends could reflect trade-offs between flexibility and reliability in the evaluated systems.