\n
## Line Chart: Accuracy vs. Iteration
### Overview
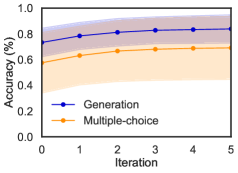
This image presents a line chart comparing the accuracy of two methods – "Generation" and "Multiple-choice" – across five iterations. The chart displays accuracy on the y-axis and iteration number on the x-axis. Each line is accompanied by a shaded region, likely representing a confidence interval or standard deviation.
### Components/Axes
* **X-axis:** Labeled "Iteration", ranging from 0 to 5. Markers are present at each integer value.
* **Y-axis:** Labeled "Accuracy (%)", ranging from 0.0 to 1.0. Markers are present at 0.2 intervals.
* **Data Series 1:** "Generation" – Represented by a blue line with circular data points.
* **Data Series 2:** "Multiple-choice" – Represented by an orange line with circular data points.
* **Legend:** Located in the bottom-center of the chart, identifying the lines by color and label.
### Detailed Analysis
**Generation (Blue Line):**
The blue line representing "Generation" shows an upward trend, starting at approximately 0.78 at Iteration 0 and increasing to approximately 0.88 at Iteration 4 and 5. The shaded region around the line indicates some variability, but the overall trend is consistently upward.
* Iteration 0: ~0.78
* Iteration 1: ~0.81
* Iteration 2: ~0.84
* Iteration 3: ~0.86
* Iteration 4: ~0.88
* Iteration 5: ~0.88
**Multiple-choice (Orange Line):**
The orange line representing "Multiple-choice" also shows an upward trend, but it is less pronounced than the "Generation" line. It starts at approximately 0.64 at Iteration 0 and increases to approximately 0.68 at Iteration 4 and 5. The shaded region around this line is also present, indicating variability.
* Iteration 0: ~0.64
* Iteration 1: ~0.65
* Iteration 2: ~0.66
* Iteration 3: ~0.67
* Iteration 4: ~0.68
* Iteration 5: ~0.68
### Key Observations
* The "Generation" method consistently outperforms the "Multiple-choice" method across all iterations.
* Both methods show improvement in accuracy with increasing iterations, but the rate of improvement appears to slow down after Iteration 3.
* The confidence intervals (represented by the shaded regions) suggest that the accuracy of the "Generation" method is more stable than that of the "Multiple-choice" method.
### Interpretation
The data suggests that the "Generation" method is more effective than the "Multiple-choice" method for the task being evaluated. The increasing accuracy with iteration for both methods indicates that the learning process is progressing, but diminishing returns are observed as the number of iterations increases. The wider confidence interval for the "Multiple-choice" method suggests that its performance is more sensitive to variations in the data or the learning process. This could be due to the inherent limitations of a multiple-choice approach compared to a generative one, which allows for more nuanced and flexible responses. The chart demonstrates the benefit of iterative improvement in both methods, but highlights the superior performance of the "Generation" approach.