## Line Chart: Accuracy Comparison Over Iterations
### Overview
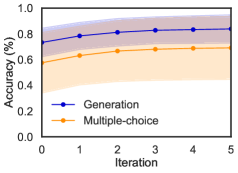
The image displays a line chart comparing the accuracy performance of two methods—"Generation" and "Multiple-choice"—across a series of iterations. The chart includes shaded regions representing confidence intervals or variance around each trend line.
### Components/Axes
- **Chart Type**: Line chart with shaded confidence bands.
- **X-Axis**:
- **Label**: "Iteration"
- **Scale**: Linear, from 0 to 5.
- **Tick Marks**: 0, 1, 2, 3, 4, 5.
- **Y-Axis**:
- **Label**: "Accuracy (%)"
- **Scale**: Linear, from 0.0 to 1.0 (representing 0% to 100%).
- **Tick Marks**: 0.0, 0.2, 0.4, 0.6, 0.8, 1.0.
- **Legend**:
- **Placement**: Bottom-right corner of the plot area.
- **Series 1**: "Generation" – represented by a blue line with circular markers.
- **Series 2**: "Multiple-choice" – represented by an orange line with circular markers.
- **Data Series**:
- Each series consists of a solid line connecting data points at each iteration (0 through 5).
- Each line is accompanied by a semi-transparent shaded band of the same color, indicating a range (likely confidence interval or standard deviation).
### Detailed Analysis
**Trend Verification & Data Points (Approximate Values):**
1. **Generation (Blue Line)**:
- **Visual Trend**: The line shows a steady, monotonic upward slope from iteration 0 to 5. The rate of increase appears to slow slightly after iteration 3.
- **Data Points**:
- Iteration 0: ~0.75
- Iteration 1: ~0.78
- Iteration 2: ~0.81
- Iteration 3: ~0.83
- Iteration 4: ~0.84
- Iteration 5: ~0.85
- **Confidence Band**: The blue shaded region is widest at iteration 0 (spanning roughly 0.65 to 0.85) and narrows progressively, becoming tightest at iteration 5 (spanning roughly 0.82 to 0.88).
2. **Multiple-choice (Orange Line)**:
- **Visual Trend**: The line also shows a steady upward slope from iteration 0 to 5. Its slope is less steep than the Generation line throughout.
- **Data Points**:
- Iteration 0: ~0.55
- Iteration 1: ~0.60
- Iteration 2: ~0.65
- Iteration 3: ~0.68
- Iteration 4: ~0.69
- Iteration 5: ~0.70
- **Confidence Band**: The orange shaded region is also widest at iteration 0 (spanning roughly 0.45 to 0.65) and narrows over iterations, but remains wider than the Generation band at iteration 5 (spanning roughly 0.65 to 0.75).
### Key Observations
1. **Performance Gap**: The "Generation" method consistently achieves higher accuracy than the "Multiple-choice" method at every iteration point.
2. **Convergence Rate**: Both methods improve over iterations, but "Generation" improves at a faster rate, widening the performance gap from ~20 percentage points at iteration 0 to ~15 percentage points at iteration 5.
3. **Uncertainty Reduction**: The narrowing of the confidence bands for both methods indicates that the variance or uncertainty in the accuracy measurement decreases as iterations progress.
4. **Non-Overlap**: After iteration 0, the confidence bands of the two methods do not appear to overlap, suggesting the performance difference is statistically significant.
### Interpretation
The chart demonstrates a clear and sustained advantage for the "Generation" method over the "Multiple-choice" method in terms of accuracy for the given task. The upward trend for both indicates that performance improves with more iterations (e.g., more training, more attempts, or more data).
The "Generation" method not only starts at a higher baseline but also learns or improves more efficiently, as evidenced by its steeper slope. The narrowing confidence intervals suggest that both methods become more consistent and reliable in their performance as the process continues, but the "Generation" method achieves higher consistency (a tighter band) at the final iteration.
This data suggests that for the underlying task, a generative approach is fundamentally more effective than a multiple-choice selection approach. The persistent gap implies the advantage is not due to initial conditions but is a property of the method itself. The lack of overlap in confidence intervals after the first iteration strongly supports the conclusion that the observed performance difference is real and not due to random chance.