## Line Chart: Levels Solved vs. Steps
### Overview
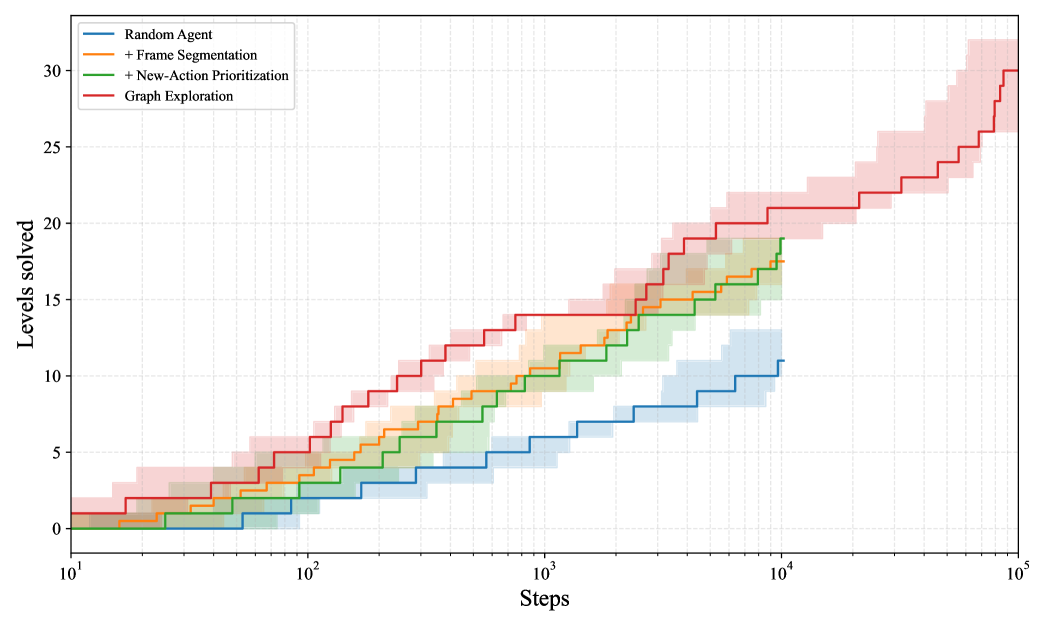
The image is a line chart comparing the performance of four different agents in solving levels, plotted against the number of steps taken. The x-axis (Steps) is on a logarithmic scale, ranging from 10^1 to 10^5. The y-axis (Levels solved) is a linear scale, ranging from 0 to 30. Each agent's performance is represented by a line with a distinct color, and shaded areas around the lines indicate variability or confidence intervals.
### Components/Axes
* **X-axis:** Steps (Logarithmic scale: 10^1, 10^2, 10^3, 10^4, 10^5)
* **Y-axis:** Levels solved (Linear scale: 0, 5, 10, 15, 20, 25, 30)
* **Legend (Top-Left):**
* Blue: Random Agent
* Orange: + Frame Segmentation
* Green: + New-Action Prioritization
* Red: Graph Exploration
### Detailed Analysis
* **Random Agent (Blue):** The line slopes upward, indicating an increase in levels solved as steps increase.
* At 10^1 steps, approximately 1 level solved.
* At 10^2 steps, approximately 2 levels solved.
* At 10^3 steps, approximately 6 levels solved.
* At 10^4 steps, approximately 11 levels solved.
* At 10^5 steps, approximately 13 levels solved.
* **+ Frame Segmentation (Orange):** The line slopes upward, indicating an increase in levels solved as steps increase.
* At 10^1 steps, approximately 1 level solved.
* At 10^2 steps, approximately 3 levels solved.
* At 10^3 steps, approximately 12 levels solved.
* At 10^4 steps, approximately 17 levels solved.
* At 10^5 steps, approximately 17 levels solved.
* **+ New-Action Prioritization (Green):** The line slopes upward, indicating an increase in levels solved as steps increase.
* At 10^1 steps, approximately 1 level solved.
* At 10^2 steps, approximately 4 levels solved.
* At 10^3 steps, approximately 10 levels solved.
* At 10^4 steps, approximately 17 levels solved.
* At 10^5 steps, approximately 17 levels solved.
* **Graph Exploration (Red):** The line slopes upward, indicating an increase in levels solved as steps increase.
* At 10^1 steps, approximately 1 level solved.
* At 10^2 steps, approximately 5 levels solved.
* At 10^3 steps, approximately 14 levels solved.
* At 10^4 steps, approximately 20 levels solved.
* At 10^5 steps, approximately 28 levels solved.
### Key Observations
* The "Graph Exploration" agent (red line) consistently solves more levels than the other agents across all step counts.
* The "Random Agent" (blue line) performs the worst, solving the fewest levels compared to the other agents.
* The "+ Frame Segmentation" (orange line) and "+ New-Action Prioritization" (green line) agents perform similarly, with "+ New-Action Prioritization" slightly outperforming "+ Frame Segmentation".
* The performance of "+ Frame Segmentation" and "+ New-Action Prioritization" plateaus after 10^4 steps.
* The shaded regions around each line indicate the variability in performance. The "Graph Exploration" agent has a wider shaded region, suggesting more variability in its performance.
### Interpretation
The chart demonstrates the effectiveness of different strategies for solving levels. The "Graph Exploration" agent, which likely uses a more sophisticated approach to explore the problem space, significantly outperforms the "Random Agent," which serves as a baseline. The "+ Frame Segmentation" and "+ New-Action Prioritization" agents show moderate improvements over the "Random Agent," suggesting that these techniques contribute to better performance, but not as significantly as "Graph Exploration." The plateauing of "+ Frame Segmentation" and "+ New-Action Prioritization" suggests that these strategies may have limitations in scaling to more complex levels or require further optimization. The variability in "Graph Exploration" performance could indicate sensitivity to specific level characteristics or randomness in the exploration process.