## Line Chart: Performance Comparison of Reinforcement Learning Agents
### Overview
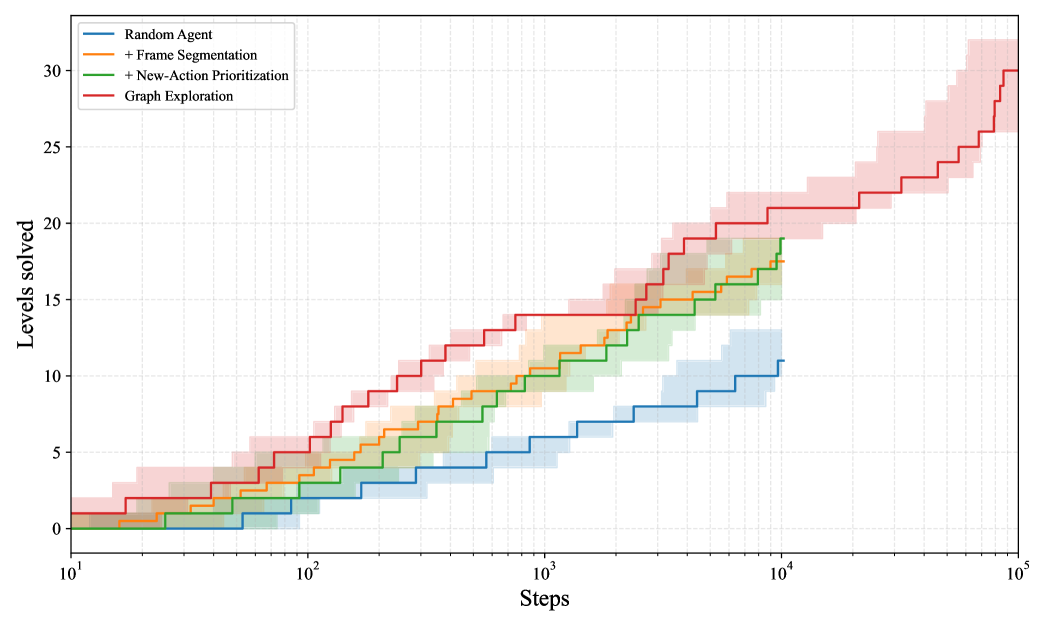
This image displays a line chart comparing the performance of four different reinforcement learning agents. The chart plots "Levels solved" (Y-axis) against the number of "Steps" taken (X-axis). The X-axis uses a logarithmic scale, spanning from $10^1$ to $10^5$ steps. The chart demonstrates that the "Graph Exploration" agent significantly outperforms the other three agents, which appear to plateau or terminate at the $10^4$ step mark.
### Components/Axes
* **X-Axis:** Labeled "Steps". It is a logarithmic scale ranging from $10^1$ to $10^5$.
* **Y-Axis:** Labeled "Levels solved". It is a linear scale ranging from 0 to 30+.
* **Legend:** Located in the top-left corner of the chart area.
* **Blue Line:** "Random Agent"
* **Orange Line:** "+ Frame Segmentation"
* **Green Line:** "+ New-Action Prioritization"
* **Red Line:** "Graph Exploration"
* **Visual Style:** The chart uses a "step" plot style, where values remain constant between steps. Shaded regions surrounding each line represent the variance or confidence interval for each agent's performance.
### Detailed Analysis
The following trends and data points are observed:
* **Blue Line (Random Agent):**