## Line Graph: Levels Solved vs. Steps for Different Agents
### Overview
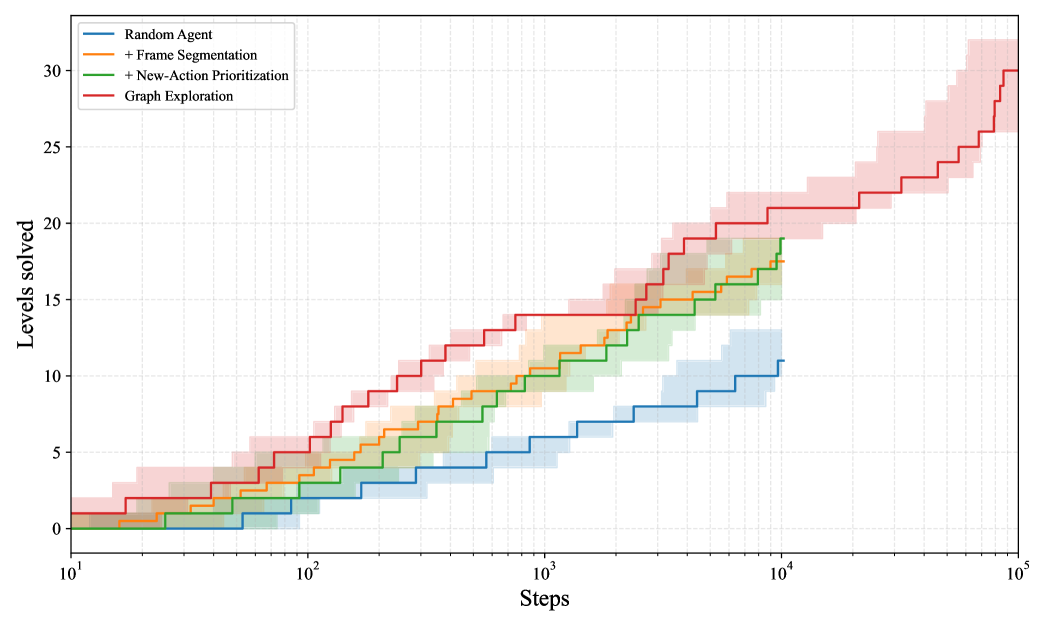
The image is a line graph comparing the performance of four agents in solving levels over a logarithmic number of steps. The y-axis represents "Levels solved" (0–30), and the x-axis represents "Steps" (10¹ to 10⁵). Four agents are compared: Random Agent (blue), Frame Segmentation (orange), New-Action Prioritization (green), and Graph Exploration (red). Shaded regions around each line indicate variability in performance.
### Components/Axes
- **X-axis (Steps)**: Logarithmic scale from 10¹ to 10⁵.
- **Y-axis (Levels solved)**: Linear scale from 0 to 30.
- **Legend**: Located in the top-left corner, with colors matching the lines:
- Blue: Random Agent
- Orange: Frame Segmentation
- Green: New-Action Prioritization
- Red: Graph Exploration
### Detailed Analysis
1. **Graph Exploration (Red)**:
- Starts at ~2 levels at 10¹ steps.
- Reaches ~30 levels by 10⁵ steps.
- Steep upward trend with consistent growth.
- Shaded region widens significantly at higher steps, indicating increased variability.
2. **New-Action Prioritization (Green)**:
- Starts at ~1 level at 10¹ steps.
- Reaches ~18 levels by 10⁵ steps.
- Slower growth than Graph Exploration but steeper than Frame Segmentation.
- Shaded region is narrower, suggesting lower variability.
3. **Frame Segmentation (Orange)**:
- Starts at ~0.5 levels at 10¹ steps.
- Reaches ~15 levels by 10⁵ steps.
- Moderate growth rate, outperforming Random Agent but lagging behind New-Action Prioritization.
- Shaded region is moderately wide.
4. **Random Agent (Blue)**:
- Starts at ~0.1 levels at 10¹ steps.
- Reaches ~10 levels by 10⁵ steps.
- Slowest growth rate, with minimal improvement over steps.
- Shaded region is the narrowest, indicating low variability.
### Key Observations
- **Graph Exploration** dominates in performance, solving the most levels across all step ranges.
- **New-Action Prioritization** and **Frame Segmentation** show intermediate performance, with the former slightly outperforming the latter.
- **Random Agent** performs the worst, with negligible improvement despite the logarithmic increase in steps.
- The shaded regions suggest that Graph Exploration has the highest variability in performance, while Random Agent is the most consistent (but least effective).
### Interpretation
The data demonstrates that **Graph Exploration** is the most effective agent, achieving near-maximal level completion (30 levels) by 10⁵ steps. Its steep growth curve and high final performance suggest it efficiently leverages step increments to solve levels. In contrast, the Random Agent’s near-linear growth indicates random or suboptimal decision-making. The shaded regions imply that Graph Exploration’s performance is less predictable at scale, possibly due to complex environmental interactions or exploration strategies. New-Action Prioritization and Frame Segmentation offer middle-ground solutions, balancing performance and consistency. This graph highlights the importance of structured exploration (Graph Exploration) over random or segmented approaches in level-solving tasks.