## Scatter Plot: Number of MC steps vs. Dimension
### Overview
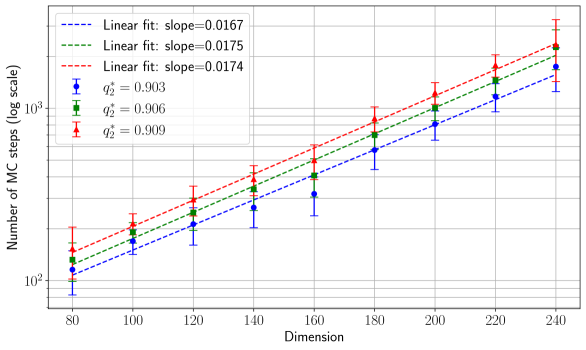
The image is a scatter plot showing the relationship between the number of Monte Carlo (MC) steps (on a logarithmic scale) and the dimension, for three different values of a parameter denoted as q₂*. Each data series is accompanied by a linear fit line. Error bars are present on each data point.
### Components/Axes
* **X-axis:** Dimension, ranging from 80 to 240 in increments of 20.
* **Y-axis:** Number of MC steps (log scale), ranging from 10² to 10³.
* **Legend (Top-Left):**
* Blue dashed line: Linear fit, slope = 0.0167
* Green dashed line: Linear fit, slope = 0.0175
* Red dashed line: Linear fit, slope = 0.0174
* Blue circles with error bars: q₂* = 0.903
* Green squares with error bars: q₂* = 0.906
* Red triangles with error bars: q₂* = 0.909
### Detailed Analysis
* **Data Series 1: q₂* = 0.903 (Blue Circles)**
* Trend: The number of MC steps increases as the dimension increases.
* Approximate Data Points:
* Dimension 80: MC steps ≈ 110
* Dimension 120: MC steps ≈ 200
* Dimension 160: MC steps ≈ 350
* Dimension 200: MC steps ≈ 700
* Dimension 240: MC steps ≈ 1500
* **Data Series 2: q₂* = 0.906 (Green Squares)**
* Trend: The number of MC steps increases as the dimension increases.
* Approximate Data Points:
* Dimension 80: MC steps ≈ 130
* Dimension 120: MC steps ≈ 250
* Dimension 160: MC steps ≈ 450
* Dimension 200: MC steps ≈ 800
* Dimension 240: MC steps ≈ 1700
* **Data Series 3: q₂* = 0.909 (Red Triangles)**
* Trend: The number of MC steps increases as the dimension increases.
* Approximate Data Points:
* Dimension 80: MC steps ≈ 140
* Dimension 120: MC steps ≈ 280
* Dimension 160: MC steps ≈ 500
* Dimension 200: MC steps ≈ 900
* Dimension 240: MC steps ≈ 1900
* **Linear Fits:** All three linear fits have positive slopes, indicating a positive correlation between dimension and the number of MC steps. The slopes are very similar, with the green line (q₂* = 0.906) having the steepest slope (0.0175), followed by the red line (q₂* = 0.909) with a slope of 0.0174, and then the blue line (q₂* = 0.903) with a slope of 0.0167.
### Key Observations
* The number of MC steps generally increases with dimension for all values of q₂*.
* Higher values of q₂* tend to result in a higher number of MC steps for a given dimension.
* The error bars suggest some variability in the number of MC steps for each dimension and q₂* value.
* The linear fits provide a good approximation of the trend in the data.
### Interpretation
The plot suggests that as the dimension increases, the number of Monte Carlo steps required for the simulation also increases. This is likely due to the increased complexity of the system with higher dimensions. The parameter q₂* appears to influence the number of MC steps, with higher values leading to a greater number of steps. The similarity in the slopes of the linear fits suggests that the rate of increase in MC steps with dimension is relatively consistent across the different q₂* values, but the offset is different. The error bars indicate that there is some inherent variability in the simulation process.