\n
## Chart: Monte Carlo Steps vs. Dimension
### Overview
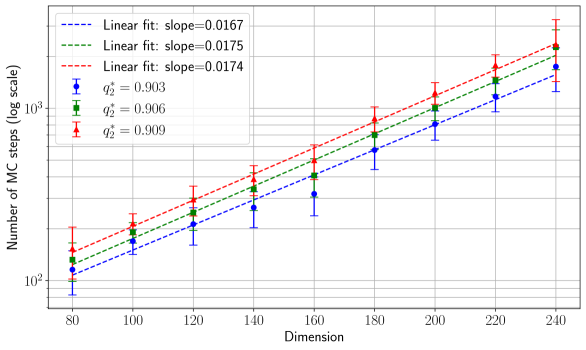
The image presents a line chart illustrating the relationship between the number of Monte Carlo (MC) steps (on a logarithmic scale) and the dimension of a system. Three different lines are plotted, each representing a different value of r² (coefficient of determination), indicating the goodness of fit of a linear model to the data. Error bars are included for each data point, representing the uncertainty in the number of MC steps.
### Components/Axes
* **X-axis:** Dimension, ranging from approximately 80 to 240.
* **Y-axis:** Number of MC steps (log scale), ranging from approximately 10 to 1000. The scale is logarithmic, with major ticks at 10, 100, and 1000.
* **Legend:** Located in the top-left corner, containing the following entries:
* Blue dashed line: "Linear fit: slope=0.0167", r² = 0.903
* Green dashed line: "Linear fit: slope=0.0175", r² = 0.906
* Red dashed line: "Linear fit: slope=0.0174", r² = 0.909
* **Data Points:** Represented by points with error bars. The color of the point corresponds to the line it belongs to (blue, green, red).
### Detailed Analysis
The chart displays three lines, each representing a linear fit to data points. All three lines exhibit a positive slope, indicating that the number of MC steps increases with increasing dimension.
* **Blue Line (r² = 0.903, slope = 0.0167):**
* At Dimension = 80, Number of MC steps ≈ 20
* At Dimension = 120, Number of MC steps ≈ 40
* At Dimension = 160, Number of MC steps ≈ 60
* At Dimension = 200, Number of MC steps ≈ 80
* At Dimension = 240, Number of MC steps ≈ 100
* Error bars are relatively consistent across the range, approximately ± 5-10.
* **Green Line (r² = 0.906, slope = 0.0175):**
* At Dimension = 80, Number of MC steps ≈ 25
* At Dimension = 120, Number of MC steps ≈ 50
* At Dimension = 160, Number of MC steps ≈ 75
* At Dimension = 200, Number of MC steps ≈ 100
* At Dimension = 240, Number of MC steps ≈ 125
* Error bars are relatively consistent across the range, approximately ± 5-10.
* **Red Line (r² = 0.909, slope = 0.0174):**
* At Dimension = 80, Number of MC steps ≈ 30
* At Dimension = 120, Number of MC steps ≈ 60
* At Dimension = 160, Number of MC steps ≈ 90
* At Dimension = 200, Number of MC steps ≈ 120
* At Dimension = 240, Number of MC steps ≈ 150
* Error bars are relatively consistent across the range, approximately ± 5-10.
The slopes of the lines are very similar, with the red line having the highest slope (0.0174) and the blue line having the lowest (0.0167). The r² values are also very close, all above 0.9, indicating a strong linear relationship in each case.
### Key Observations
* The number of MC steps required increases linearly with dimension.
* The red line (highest r² value) appears to fit the data slightly better than the other two lines.
* The error bars suggest a consistent level of uncertainty in the number of MC steps across the range of dimensions.
* The lines are relatively parallel, indicating that the rate of increase in MC steps with dimension is similar for all three cases.
### Interpretation
The chart demonstrates a positive correlation between the dimension of a system and the number of Monte Carlo steps required to achieve a certain level of accuracy or convergence. The linear fits suggest that this relationship is approximately linear within the observed range of dimensions. The higher r² value for the red line indicates that the linear model provides a slightly better fit to the data for that particular case.
The fact that all three lines have high r² values and similar slopes suggests that the relationship between MC steps and dimension is relatively consistent, regardless of the specific parameter represented by the different lines (indicated by the different r² values). The error bars provide a measure of the uncertainty in the number of MC steps, which is important for assessing the reliability of the results.
The increasing trend suggests that as the dimensionality of the system increases, the computational cost of performing Monte Carlo simulations also increases. This is a common phenomenon in many scientific and engineering applications, and it highlights the importance of developing efficient algorithms and computational techniques for dealing with high-dimensional problems.