## Line Chart: Relationship Between Dimension and Number of MC Steps
### Overview
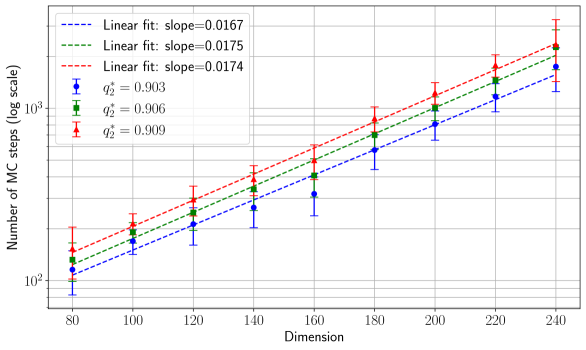
The image is a line chart depicting the relationship between "Dimension" (x-axis) and "Number of MC steps (log scale)" (y-axis). Three data series are plotted, each with distinct slopes and associated *q*<sub>2</sub> values. The chart uses a logarithmic scale for the y-axis, and error bars are present for all data points.
---
### Components/Axes
- **X-axis (Dimension)**: Labeled "Dimension," with ticks at intervals of 20 (80, 100, 120, ..., 240).
- **Y-axis (Number of MC steps)**: Labeled "Number of MC steps (log scale)," with values ranging from 10² to 10³.
- **Legend**: Positioned in the top-left corner, containing three entries:
- **Blue line**: Slope = 0.0167, *q*<sub>2</sub> = 0.903 (marked with circles).
- **Green line**: Slope = 0.0175, *q*<sub>2</sub> = 0.906 (marked with squares).
- **Red line**: Slope = 0.0174, *q*<sub>2</sub> = 0.909 (marked with triangles).
---
### Detailed Analysis
1. **Data Series Trends**:
- All three lines exhibit an **upward trend**, consistent with the logarithmic scale.
- **Blue line** (slope = 0.0167): Lowest slope, corresponding to *q*<sub>2</sub> = 0.903.
- **Red line** (slope = 0.0174): Intermediate slope, *q*<sub>2</sub> = 0.909.
- **Green line** (slope = 0.0175): Steepest slope, *q*<sub>2</sub> = 0.906.
- The slopes are very close, suggesting a weak sensitivity to *q*<sub>2</sub> in this range.
2. **Error Bars**:
- All data points include error bars, indicating variability in the measured values.
- The error bars are relatively small compared to the data points, suggesting moderate precision.
3. **Logarithmic Scale**:
- The y-axis uses a log scale, which linearizes the exponential growth of MC steps with dimension.
- The straight-line fits confirm a power-law relationship between dimension and MC steps.
---
### Key Observations
- **Slope vs. *q*<sub>2</sub>**:
- Higher *q*<sub>2</sub> values (e.g., 0.909) correspond to steeper slopes (0.0174–0.0175), while lower *q*<sub>2</sub> (0.903) has the shallowest slope (0.0167).
- The relationship between *q*<sub>2</sub> and slope is non-linear, as the increase in *q*<sub>2</sub> does not proportionally increase the slope.
- **Data Point Placement**:
- All lines pass through the origin (0, 10²) implicitly, as the log scale starts at 10².
- At dimension = 240, the green line (highest slope) reaches ~10³ MC steps, while the blue line reaches ~500 MC steps.
- **Error Bar Consistency**:
- Error bars are visually similar across all lines, suggesting comparable uncertainty in measurements.
---
### Interpretation
The chart demonstrates that the number of Monte Carlo (MC) steps required scales linearly with dimension on a logarithmic scale. The slope of this relationship is weakly correlated with the *q*<sub>2</sub> parameter, which quantifies some property of the system (e.g., convergence rate or efficiency).
- **Trend Implications**:
- As dimension increases, the computational cost (MC steps) grows exponentially, as indicated by the log scale.
- The slight differences in slopes suggest that *q*<sub>2</sub> may influence the efficiency of the MC method, but the effect is minimal within the tested range (0.903–0.909).
- **Practical Significance**:
- For high-dimensional problems, the exponential growth of MC steps highlights the need for optimization strategies (e.g., adaptive sampling or parallelization).
- The weak dependence on *q*<sub>2</sub> implies that small changes in this parameter may not significantly alter computational requirements.
- **Anomalies**:
- No outliers are observed; all data points align closely with their respective linear fits.
- The error bars do not indicate systematic deviations, reinforcing the reliability of the trends.
---
### Conclusion
This chart underscores the computational challenges of high-dimensional MC simulations, where the number of steps grows exponentially with dimension. While *q*<sub>2</sub> influences the slope of this growth, its impact is limited in the tested range. The results emphasize the importance of optimizing *q*<sub>2</sub> and other parameters to mitigate the curse of dimensionality in MC methods.