## Diagram: Airflow Dynamics (Stack Effect)
### Overview
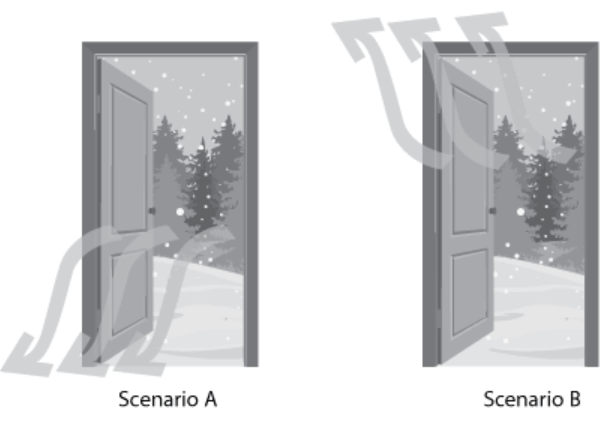
The image consists of two side-by-side illustrations, labeled "Scenario A" and "Scenario B." Both panels depict an identical doorway opening into a cold, snowy, forested environment. The primary purpose of the diagram is to illustrate vector-based airflow patterns (fluid dynamics) through an opening under different pressure or thermal conditions.
### Components
* **Scenario A (Left Panel):**
* **Subject:** A doorway opening into a snowy forest.
* **Visual Indicators:** Three translucent, curved arrows originating from the bottom threshold of the door, pointing downward and outward.
* **Label:** "Scenario A" positioned directly below the doorway.
* **Scenario B (Right Panel):**
* **Subject:** An identical doorway opening into the same snowy forest.
* **Visual Indicators:** Three translucent, curved arrows originating from the top frame of the door, pointing upward and outward.
* **Label:** "Scenario B" positioned directly below the doorway.
### Detailed Analysis
* **Scenario A (Bottom Flow):** The visual data indicates a flow of air exiting the building at the lower portion of the door frame. The arrows are curved, suggesting a laminar or semi-laminar flow pattern moving from the interior threshold toward the exterior.
* **Scenario B (Top Flow):** The visual data indicates a flow of air exiting the building at the upper portion of the door frame. Similar to Scenario A, the arrows are curved, suggesting a flow pattern moving from the interior header toward the exterior.
### Key Observations
* **Symmetry:** The background environment (snowy forest) and the door structure are identical in both scenarios, isolating the airflow vectors as the only variable.
* **Vector Directionality:** The diagrams are mutually exclusive in their flow direction; Scenario A focuses on the bottom of the aperture, while Scenario B focuses on the top.
* **Qualitative Data:** There are no numerical values (e.g., pressure in Pascals, temperature in degrees, or velocity in m/s). The data is purely qualitative, representing directional flow.
### Interpretation
This diagram is a classic representation of the **Stack Effect** (or chimney effect) in building science and thermodynamics.
* **The Physics:** The stack effect is driven by the density difference between warm indoor air and cold outdoor air. Warm air is less dense and rises, while cold air is denser and sinks.
* **Scenario B (The Standard Stack Effect):** This illustrates the typical behavior of a heated building in winter. Warm, buoyant air rises to the top of the building and escapes through upper openings (the top of the door). This creates a negative pressure at the bottom of the building, which draws cold air in.
* **Scenario A (Pressure Differential/Counter-flow):** This illustrates a scenario where air is being forced out at the bottom. This could represent a building under positive pressure (e.g., mechanical ventilation pushing air out) or a specific localized pressure differential where the interior pressure at the floor level exceeds the exterior pressure.
* **Conclusion:** The diagram serves as a comparative tool to demonstrate how air pressure and thermal buoyancy dictate the direction of air movement through building envelopes. It highlights that an opening in a building is rarely neutral; it acts as either an intake or an exhaust depending on the vertical position and the internal/external pressure relationship.