\n
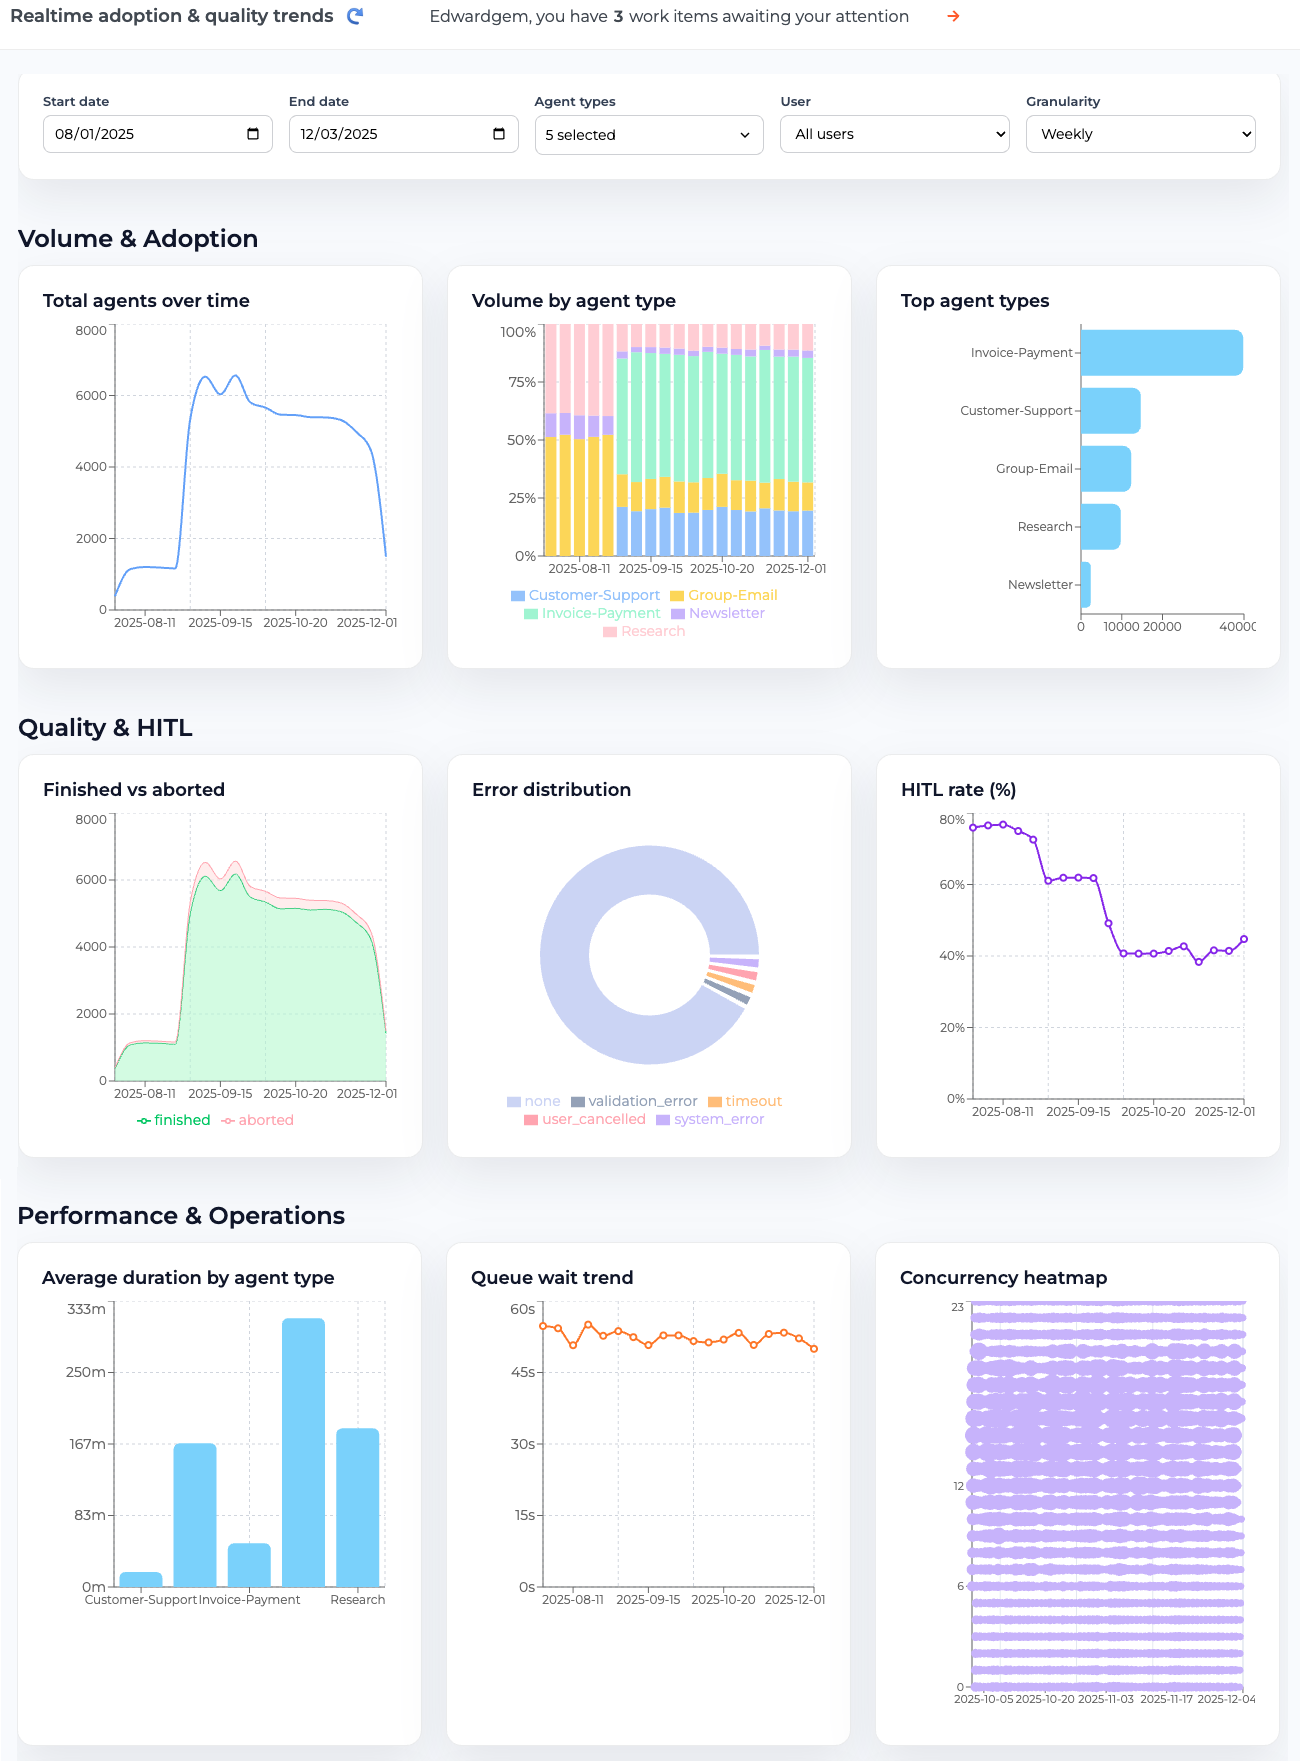
## Dashboard: Realtime Adoption & Quality Trends
### Overview
This dashboard presents a collection of charts and metrics related to adoption, quality, and operational performance, likely within a customer support or task management system. The data spans from approximately August 11, 2025, to December 3, 2025. The dashboard is segmented into sections: Volume & Adoption, Quality & HITL, and Performance & Operations.
### Components/Axes
* **Date Range Selector:** Start Date (08/01/2025), End Date (12/03/2025)
* **Filters:** Agent types (5 selected), User (All users), Granularity (Weekly)
* **Total Agents Over Time:** X-axis: Date (2025-08-11 to 2025-12-01), Y-axis: Total Agents (0 to 8000)
* **Volume by Agent Type:** X-axis: Date (2025-08-11 to 2025-12-01), Y-axis: Percentage (0% to 100%). Legend: Customer-Support, Group-Email, Invoice-Payment, Newsletter, Research.
* **Top Agent Types:** X-axis: Volume (0 to 4000c), Y-axis: Agent Type (Invoice-Payment, Customer Support, Group-Email, Research, Newsletter)
* **Finished vs Aborted:** X-axis: Date (2025-08-11 to 2025-12-01), Y-axis: Count (0 to 8000). Legend: Finished, Aborted.
* **Error Distribution:** Pie chart with segments representing error types. Legend: none, validation\_error, Timeout, user\_cancelled, system\_error.
* **HITL Rate (%):** X-axis: Date (2025-08-11 to 2025-12-01), Y-axis: HITL Rate (%) (0% to 80%).
* **Average Duration by Agent Type:** X-axis: Agent Type (Customer Support, Invoice-Payment, Research), Y-axis: Duration (0m to 3.33m).
* **Queue Wait Trend:** X-axis: Date (2025-08-11 to 2025-12-01), Y-axis: Wait Time (0s to 45s).
* **Concurrency Heatmap:** X-axis: Date (2025-10-05 to 2025-12-04), Y-axis: Concurrency (0 to 23).
### Detailed Analysis or Content Details
**Volume & Adoption**
* **Total Agents Over Time:** The line starts at approximately 2000 agents on 2025-08-11, rises to a peak of around 7500 agents around 2025-09-15, and then declines to approximately 3000 agents by 2025-12-01.
* **Volume by Agent Type:**
* Customer-Support: Starts around 20% on 2025-08-11, fluctuates between 20-60% throughout the period, ending around 40% on 2025-12-01.
* Group-Email: Remains relatively stable around 20-30% throughout the period.
* Invoice-Payment: Starts around 50% on 2025-08-11, decreases to around 20% by 2025-09-15, and then increases to around 40% on 2025-12-01.
* Newsletter: Remains consistently low, around 5-10%.
* Research: Starts around 10% on 2025-08-11, increases to around 30% by 2025-09-15, and then decreases to around 10% on 2025-12-01.
* **Top Agent Types:** Invoice-Payment has the highest volume, followed by Customer Support, Group-Email, Research, and Newsletter. Approximate volumes are: Invoice-Payment (3500), Customer Support (2500), Group-Email (2000), Research (1500), Newsletter (500).
**Quality & HITL**
* **Finished vs Aborted:** The "Finished" line starts at approximately 2000 on 2025-08-11, rises to a peak of around 7000 on 2025-09-15, and then declines to approximately 2000 on 2025-12-01. The "Aborted" line remains consistently low, below 1000 throughout the period.
* **Error Distribution:** The "none" segment occupies the largest portion of the pie chart (approximately 60%), followed by "validation\_error" (20%), "Timeout" (10%), "user\_cancelled" (5%), and "system\_error" (5%).
* **HITL Rate (%):** The line starts at approximately 40% on 2025-08-11, fluctuates between 30-50% throughout the period, ending around 40% on 2025-12-01.
**Performance & Operations**
* **Average Duration by Agent Type:** Customer Support has the longest average duration (approximately 3.33m), followed by Invoice-Payment (approximately 1.5m), and Research (approximately 0.5m).
* **Queue Wait Trend:** The line starts at approximately 15s on 2025-08-11, rises to a peak of around 40s on 2025-09-15, and then declines to approximately 10s on 2025-12-01.
* **Concurrency Heatmap:** The heatmap shows varying levels of concurrency over time. The highest concurrency (around 23) is observed around 2025-11-20, while the lowest concurrency (around 6) is observed around 2025-10-05.
### Key Observations
* There's a significant peak in both total agents and finished tasks around mid-September 2025.
* Invoice-Payment consistently has the highest volume of agent activity.
* The majority of errors are "none" or "validation\_error", suggesting a relatively stable system with occasional validation issues.
* Customer Support tasks have the longest average duration.
* Concurrency peaks in late November 2025.
### Interpretation
The dashboard suggests a system experiencing growth in agent adoption, peaking in mid-September, followed by a decline. The distribution of agent types indicates that Invoice-Payment is a key driver of activity. The high proportion of "none" errors suggests a generally reliable system, but the presence of "validation\_error" indicates areas for potential improvement in data input or processing. The longer duration for Customer Support tasks may indicate more complex issues or a need for additional training or resources. The concurrency heatmap reveals periods of high system load, which could impact performance and require capacity planning. The HITL rate remains relatively stable, suggesting consistent human oversight. Overall, the dashboard provides a comprehensive overview of system health and performance, highlighting areas of strength and potential areas for optimization. The data suggests a cyclical pattern of activity, with peaks and troughs in agent adoption, task completion, and system load. Further investigation could focus on understanding the factors driving these cycles and optimizing resource allocation accordingly.