TECHNICAL ASSET FINGERPRINT
180c4d92bcb658bd5caafac8
Click to view fullscreen
Press ESC or click to close
FOUND IN PAPERS
EXPERT: healer-alpha-free VERSION 1
RUNTIME: free/openrouter/healer-alpha
INTEL_VERIFIED
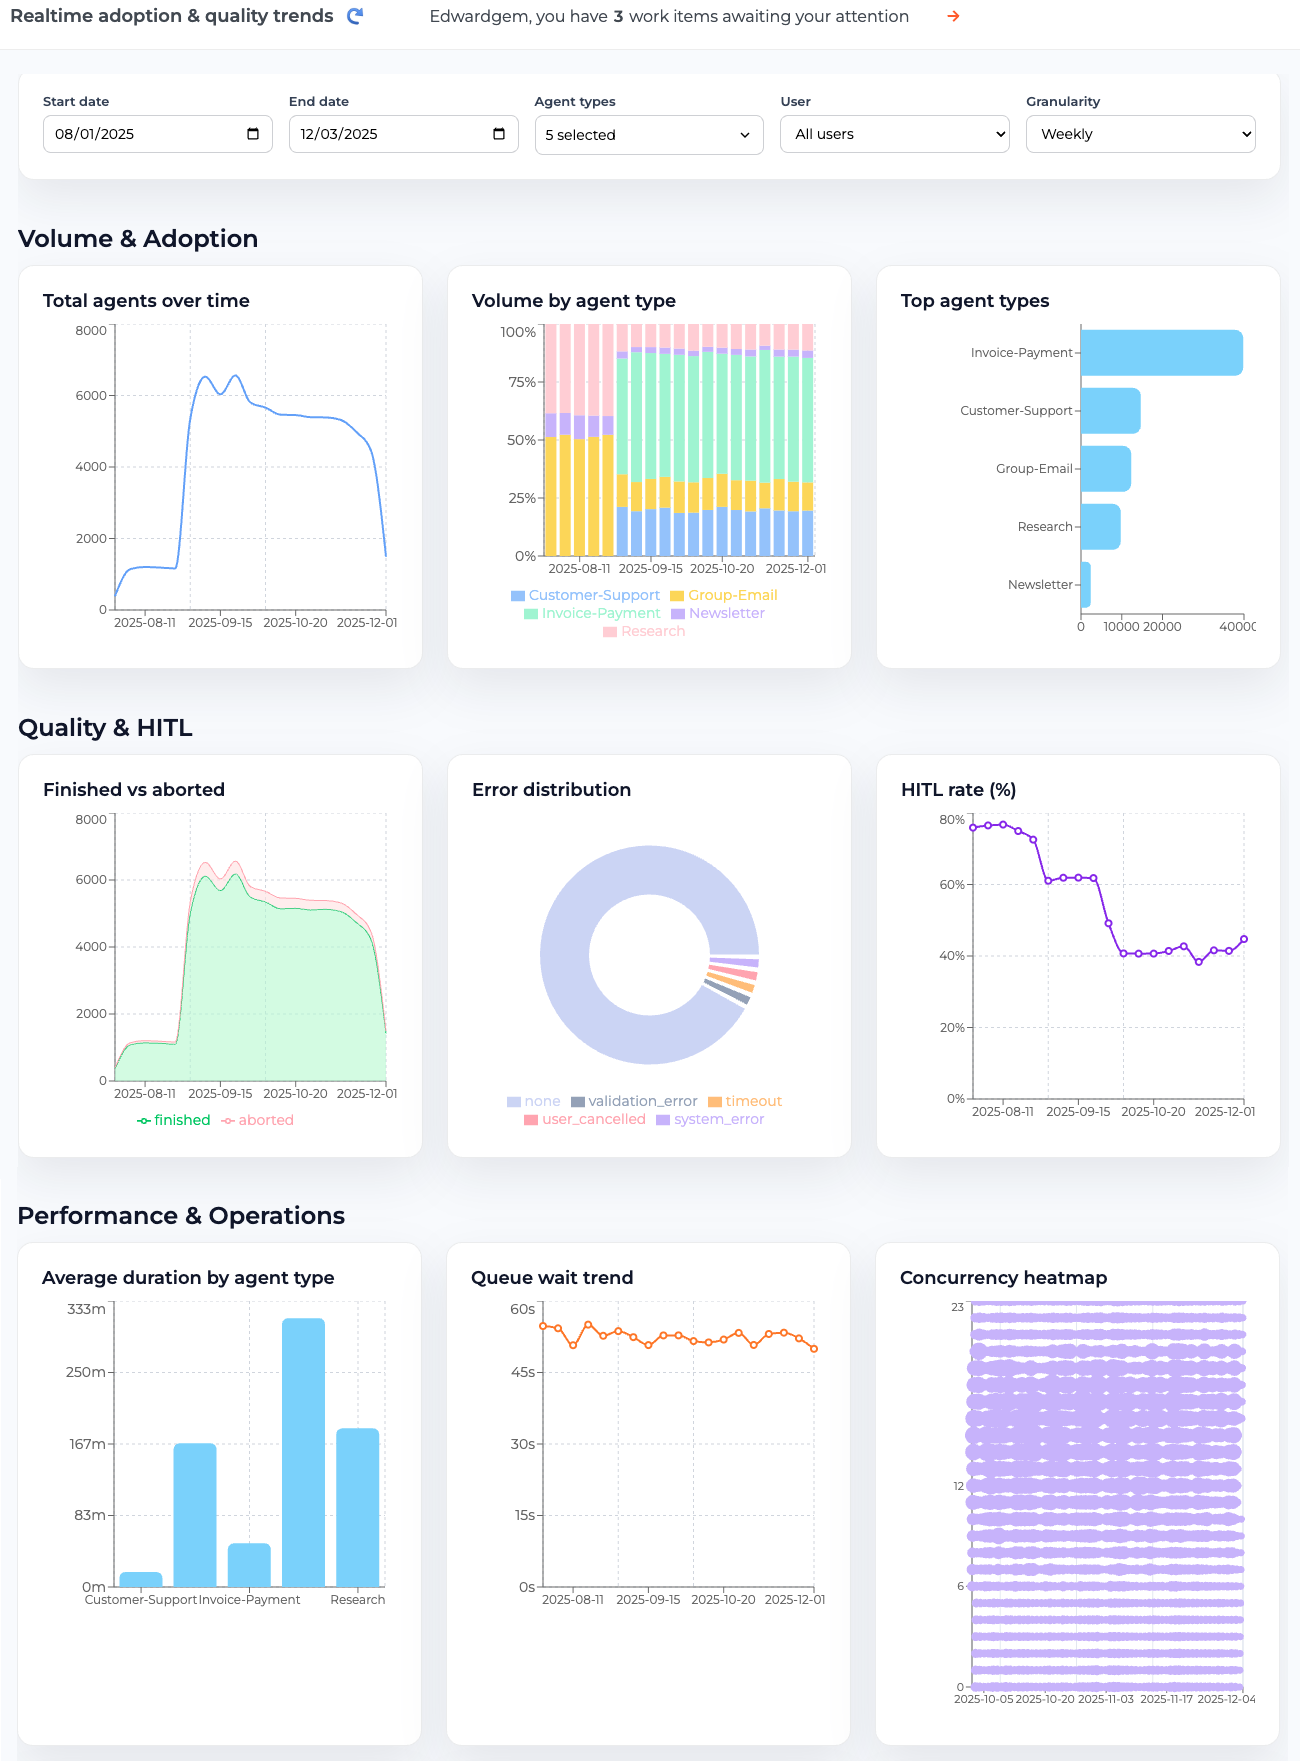
## Dashboard: Realtime Adoption & Quality Trends
### Overview
This image displays a comprehensive analytics dashboard titled "Realtime adoption & quality trends." It presents a series of charts and metrics organized into three main sections: Volume & Adoption, Quality & HITL (Human-In-The-Loop), and Performance & Operations. The dashboard is filtered for a specific date range and user group, showing weekly aggregated data.
### Components/Axes
**Header & Filters:**
* **Title:** "Realtime adoption & quality trends" (top-left).
* **Notification:** "Edwardgem, you have 3 work items awaiting your attention" (top-center).
* **Filter Bar:**
* **Start date:** 08/01/2025
* **End date:** 12/03/2025
* **Agent types:** "5 selected"
* **User:** "All users"
* **Granularity:** "Weekly"
**Section 1: Volume & Adoption**
* **Chart 1: Total agents over time** (Line Chart)
* **Y-axis:** Linear scale from 0 to 8000.
* **X-axis:** Date range from approximately 2025-08-11 to 2025-12-01.
* **Chart 2: Volume by agent type** (100% Stacked Bar Chart)
* **Y-axis:** Percentage scale from 0% to 100%.
* **X-axis:** Date markers for 2025-08-11, 2025-09-15, 2025-10-20, 2025-12-01.
* **Legend (Bottom):** Customer-Support (blue), Group-Email (yellow), Invoice-Payment (green), Newsletter (purple), Research (pink).
* **Chart 3: Top agent types** (Horizontal Bar Chart)
* **X-axis:** Linear scale from 0 to 40,000.
* **Y-axis (Categories):** Invoice-Payment, Customer-Support, Group-Email, Research, Newsletter.
**Section 2: Quality & HITL**
* **Chart 4: Finished vs aborted** (Area Chart)
* **Y-axis:** Linear scale from 0 to 8000.
* **X-axis:** Date range from approximately 2025-08-11 to 2025-12-01.
* **Legend (Bottom):** finished (green line/area), aborted (pink line/area).
* **Chart 5: Error distribution** (Donut Chart)
* **Segments (from largest to smallest):** none (light purple), validation_error (dark blue), timeout (orange), user_cancelled (red), system_error (purple).
* **Legend (Bottom):** none, validation_error, timeout, user_cancelled, system_error.
* **Chart 6: HITL rate (%)** (Line Chart)
* **Y-axis:** Percentage scale from 0% to 80%.
* **X-axis:** Date range from approximately 2025-08-11 to 2025-12-01.
**Section 3: Performance & Operations**
* **Chart 7: Average duration by agent type** (Vertical Bar Chart)
* **Y-axis:** Linear scale from 0m to 333m (likely minutes).
* **X-axis (Categories):** Customer-Support, Invoice-Payment, Research. (Note: Only three categories are labeled, but there appear to be 5 bars total).
* **Chart 8: Queue wait trend** (Line Chart)
* **Y-axis:** Linear scale from 0s to 60s (seconds).
* **X-axis:** Date range from approximately 2025-08-11 to 2025-12-01.
* **Chart 9: Concurrency heatmap** (Heatmap)
* **Y-axis:** Linear scale from 0 to 23 (likely representing hours of the day).
* **X-axis:** Date range from approximately 2025-10-05 to 2025-12-04.
* **Color Scale:** Light purple to dark purple, indicating increasing concurrency intensity.
### Detailed Analysis
**Volume & Adoption:**
1. **Total agents over time:** The line shows a sharp increase starting around late August 2025, peaking at approximately 6,500 agents in mid-September. It then plateaus around 5,500-6,000 before a steep decline beginning in late November, dropping below 2,000 by early December.
2. **Volume by agent type:** The composition changes significantly over time. In early August, "Customer-Support" (blue) and "Group-Email" (yellow) dominate. By mid-September, "Invoice-Payment" (green) becomes the largest segment, comprising over 50% of the volume, and maintains this dominance through December. "Research" (pink) and "Newsletter" (purple) remain small, stable segments.
3. **Top agent types:** "Invoice-Payment" has the highest volume, with its bar extending to approximately 40,000. "Customer-Support" is next at ~15,000, followed by "Group-Email" (~12,000), "Research" (~8,000), and "Newsletter" (~2,000).
**Quality & HITL:**
1. **Finished vs aborted:** The "finished" (green) and "aborted" (pink) lines follow a nearly identical trend to the "Total agents over time" chart. The "finished" volume is consistently higher than "aborted." Both peak in mid-September (~6,000 finished, ~500 aborted) and decline sharply in late November.
2. **Error distribution:** The vast majority of outcomes fall into the "none" category (light purple), representing successful completions without errors. The remaining errors are distributed among "validation_error," "timeout," "user_cancelled," and "system_error," with each appearing to be less than 10% of the total.
3. **HITL rate (%):** The Human-In-The-Loop rate shows a clear downward trend. It starts near 80% in early August, drops to around 60% by mid-September, and falls further to fluctuate between 40-50% from October through December.
**Performance & Operations:**
1. **Average duration by agent type:** "Invoice-Payment" has the longest average duration, reaching the top of the scale at ~333 minutes. "Research" is next at ~180m, followed by "Customer-Support" at ~160m. Two unlabeled bars show much shorter durations (~30m and ~60m).
2. **Queue wait trend:** The average queue wait time remains relatively stable, fluctuating between approximately 45 and 55 seconds throughout the period, with a very slight downward trend visible from October onward.
3. **Concurrency heatmap:** The heatmap shows consistent, high concurrency (darker purple bands) across most hours of the day (Y-axis 0-23) throughout the displayed period (Oct-Dec). There are no obvious low-concurrency hours or days, suggesting sustained, around-the-clock usage.
### Key Observations
* **Volume Peak and Decline:** A major adoption event occurred in September 2025, driving a peak in total agent volume, which was not sustained and declined sharply by year-end.
* **Dominance of Invoice-Payment:** The "Invoice-Payment" agent type became the dominant use case by volume in September and also has the longest average task duration.
* **Improving Automation:** The steadily decreasing HITL rate suggests the system is becoming more automated or reliable over time, requiring less human intervention.
* **Stable Operational Metrics:** Despite large swings in volume, queue wait times remained stable, indicating robust operational scaling. Concurrency was consistently high.
* **Error Profile:** Errors are a small minority of outcomes, with "none" (success) being the overwhelming category.
### Interpretation
This dashboard tells a story of a system experiencing a rapid, successful adoption surge for a specific function (Invoice-Payment) in Q3 2025, followed by a significant contraction in overall usage by Q4. The data suggests the initial spike may have been due to a specific project, campaign, or onboarding wave that concluded.
The concurrent decline in the HITL rate is a positive indicator of system maturation—as usage patterns became established (particularly for the dominant Invoice-Payment flow), the agents likely required less human oversight. The stability of queue wait times amidst volatile volume is a key operational success, showing the backend infrastructure could handle the peak load without degrading user experience. The persistent high concurrency in the heatmap indicates the tool is integral to continuous, likely global, business processes.
The sharp drop in total agents at the end of the period raises questions: Was this a planned wind-down, a seasonal effect, or an indication of a problem? The dashboard itself doesn't provide the cause, but it clearly flags this trend as requiring investigation. The dominance of a single agent type (Invoice-Payment) also presents a risk; the system's health is heavily tied to the demand for that one function.
DECODING INTELLIGENCE...