## Dashboard: Real-time Adoption & Quality Trends
### Overview
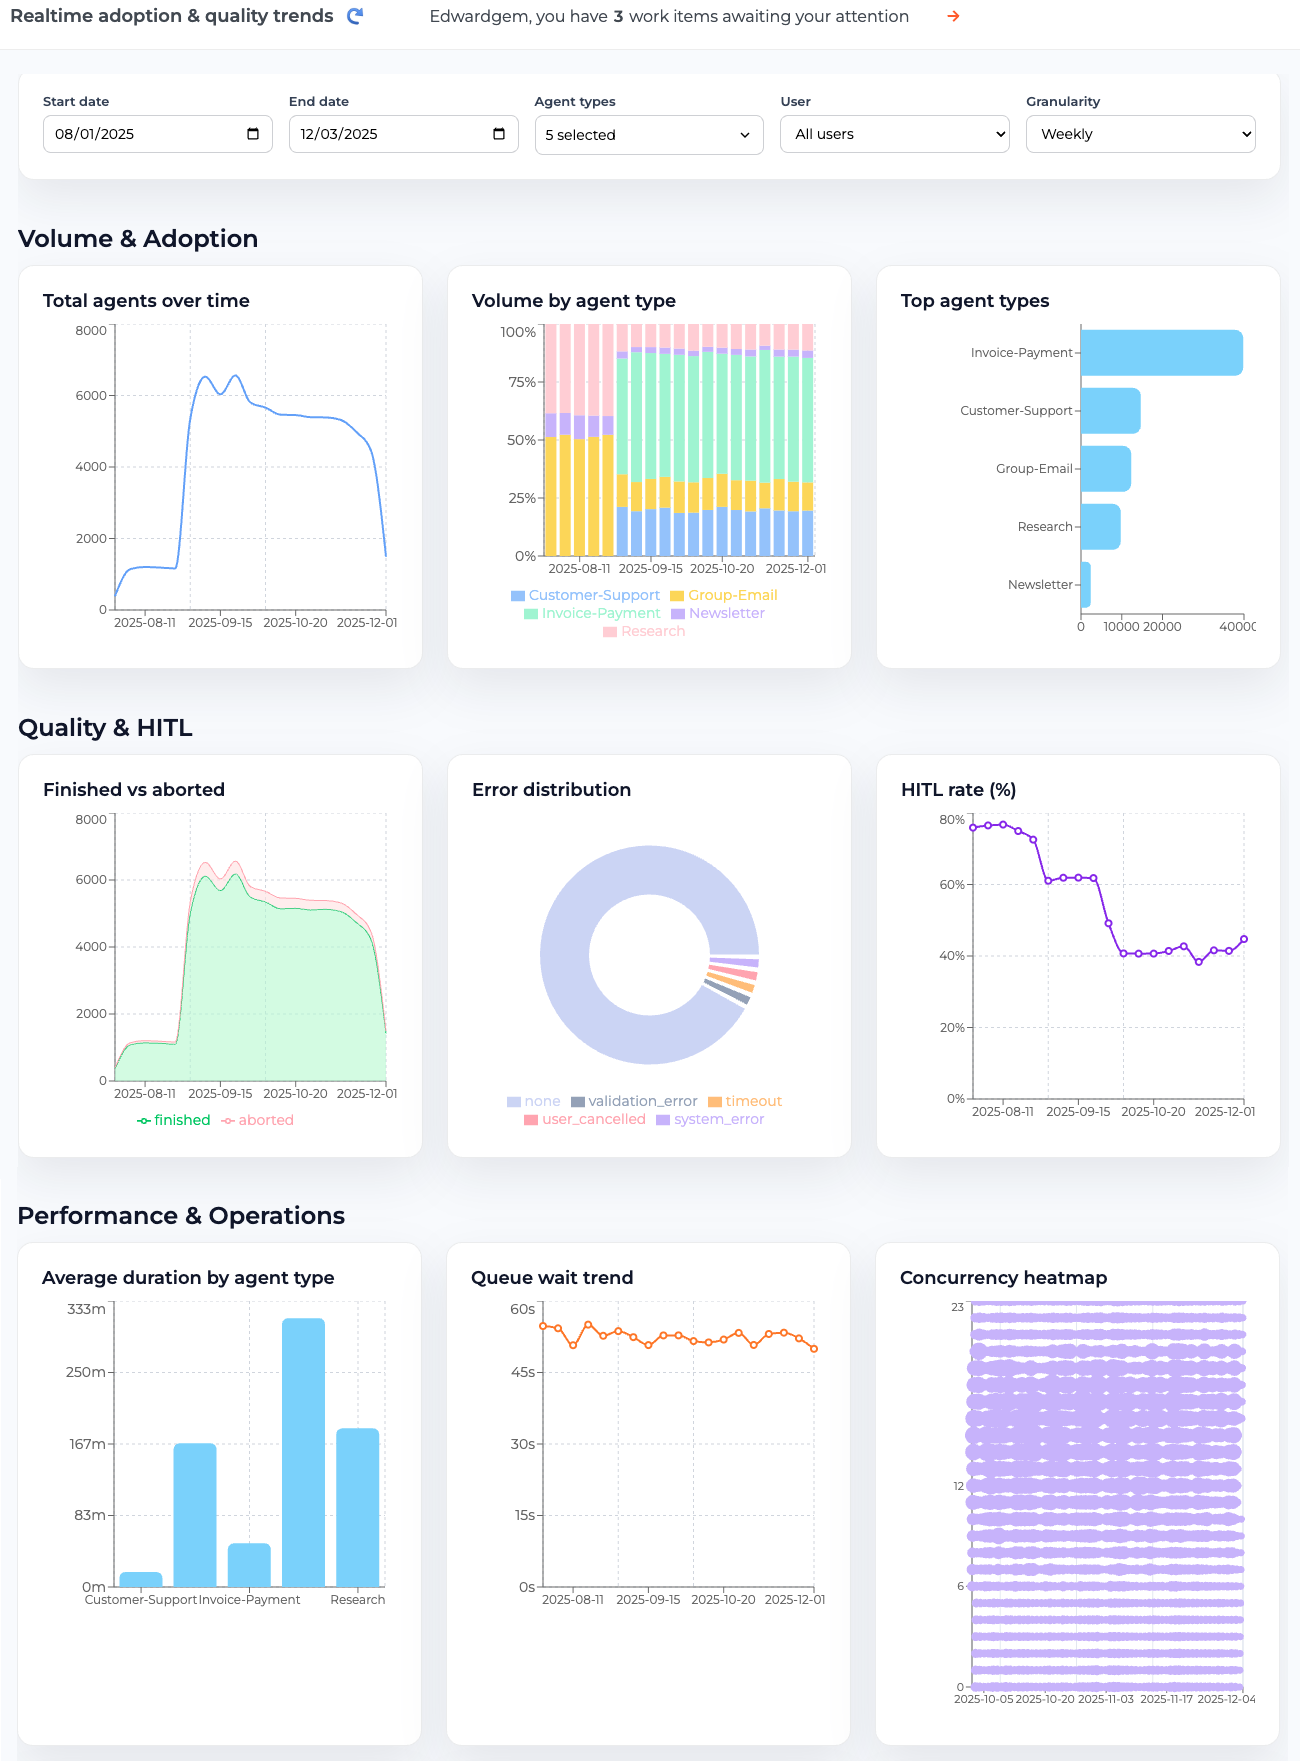
The dashboard presents a comprehensive analysis of agent performance, quality metrics, and operational efficiency across multiple dimensions. It includes time-series data, categorical distributions, and comparative visualizations spanning August 1, 2025, to December 3, 2025.
---
### Components/Axes
#### Header Section
- **Date Range**: Start: 08/01/2025 | End: 12/03/2025
- **Filters**:
- Agent Types: 5 selected (dropdown)
- User: All users (dropdown)
- Granularity: Weekly (dropdown)
#### Volume & Adoption Section
1. **Total Agents Over Time**
- **X-axis**: Dates (2025-08-11 to 2025-12-01)
- **Y-axis**: Agent count (0–8000)
- **Legend**: Single blue line
- **Trend**: Sharp rise to ~6000 agents by 2025-09-15, followed by a decline to ~1500 by 2025-12-01.
2. **Volume by Agent Type**
- **X-axis**: Dates (2025-08-11 to 2025-12-01)
- **Y-axis**: Percentage (0–100%)
- **Legend**:
- Customer-Support (blue)
- Group-Email (orange)
- Invoice-Payment (green)
- Newsletter (purple)
- Research (pink)
- **Trend**: Invoice-Payment dominates (~75% of stack), with Customer-Support (~20%) and Group-Email (~10%) as secondary contributors.
3. **Top Agent Types**
- **X-axis**: Count (0–40,000)
- **Y-axis**: Agent types (horizontal bars)
- **Values**:
- Invoice-Payment: ~35,000
- Customer-Support: ~15,000
- Group-Email: ~10,000
- Research: ~8,000
- Newsletter: ~3,000
#### Quality & HITL Section
1. **Finished vs Aborted**
- **X-axis**: Dates (2025-08-11 to 2025-12-01)
- **Y-axis**: Count (0–8000)
- **Legend**:
- Finished (green)
- Aborted (pink)
- **Trend**: Finished tasks peak at ~6000, while aborted tasks remain below 1000.
2. **Error Distribution**
- **Pie Chart Segments**:
- None (light blue): ~85%
- Validation Error (dark blue): ~10%
- Timeout (orange): ~3%
- User Cancelled (red): ~1.5%
- System Error (purple): ~0.5%
3. **HITL Rate (%)**
- **X-axis**: Dates (2025-08-11 to 2025-12-01)
- **Y-axis**: Percentage (0–80%)
- **Legend**: Purple line
- **Trend**: Starts at ~75%, drops sharply to ~40% by 2025-10-15, then stabilizes with minor fluctuations.
#### Performance & Operations Section
1. **Average Duration by Agent Type**
- **X-axis**: Agent types (Customer-Support, Invoice-Payment, Research)
- **Y-axis**: Duration (0–333ms)
- **Values**:
- Customer-Support: ~167ms
- Invoice-Payment: ~333ms
- Research: ~167ms
2. **Queue Wait Trend**
- **X-axis**: Dates (2025-10-05 to 2025-12-04)
- **Y-axis**: Wait time (0–60s)
- **Legend**: Orange line
- **Trend**: Fluctuates between 45s and 55s with no clear upward/downward pattern.
3. **Concurrency Heatmap**
- **X-axis**: Dates (2025-10-05 to 2025-12-04)
- **Y-axis**: Concurrency levels (0, 6, 12, 23)
- **Legend**: Purple lines
- **Trend**: Consistent horizontal lines indicate stable concurrency levels across dates.
---
### Key Observations
1. **Agent Volume**: Sharp initial growth followed by a steep decline suggests a temporary surge in demand or resource allocation.
2. **Agent Type Dominance**: Invoice-Payment handles the majority of workload, while Newsletter has the smallest footprint.
3. **Quality Metrics**: High HITL rates (>75%) initially drop significantly, indicating potential process inefficiencies or automation improvements.
4. **Error Patterns**: Validation errors and timeouts are the primary failure modes, with user cancellations being rare.
5. **Operational Efficiency**: Invoice-Payment tasks take twice as long as Customer-Support/Research tasks, suggesting potential optimization opportunities.
---
### Interpretation
The data reveals a dynamic operational landscape with significant shifts in agent activity and quality metrics. The initial surge in agents (Volume & Adoption) correlates with high HITL rates, suggesting manual intervention during peak demand. The subsequent decline in agents coincides with a drop in HITL rates, possibly indicating automation adoption or process streamlining.
The dominance of Invoice-Payment tasks, combined with their longer average duration, highlights a potential bottleneck. Meanwhile, the stability in queue wait times despite fluctuating agent numbers suggests effective load balancing. Error distribution emphasizes the need to address validation and timeout issues, which account for ~13% of failures.
The concurrency heatmap’s uniformity implies consistent system load, but the lack of granularity (e.g., hourly breakdowns) limits deeper analysis. Overall, the dashboard underscores the need for targeted optimizations in high-volume, high-duration tasks and error-prone processes.