## Scatter Plot with Marginal Distributions: Security Studies Confidence vs. Target Length
### Overview
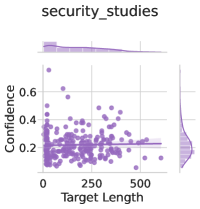
The image is a statistical visualization, specifically a scatter plot with marginal distributions (histogram on top, density plot on the right). It displays the relationship between "Target Length" and "Confidence" for a dataset or category labeled "security_studies". The plot uses a monochromatic purple color scheme.
### Components/Axes
* **Title:** "security_studies" (centered at the top).
* **Main Plot Area:** A scatter plot with data points represented as purple circles.
* **X-Axis:**
* **Label:** "Target Length" (centered below the axis).
* **Scale:** Linear, ranging from 0 to approximately 700.
* **Major Tick Marks:** 0, 250, 500.
* **Y-Axis:**
* **Label:** "Confidence" (centered to the left, rotated 90 degrees).
* **Scale:** Linear, ranging from 0.0 to approximately 0.8.
* **Major Tick Marks:** 0.2, 0.4, 0.6.
* **Legend:** Located in the top-left corner of the main plot area. Contains a purple square symbol followed by the text "security_studies".
* **Marginal Distributions:**
* **Top (X-axis distribution):** A histogram showing the frequency distribution of "Target Length". It is heavily right-skewed, with the highest bar between 0-100.
* **Right (Y-axis distribution):** A density plot (smoothed histogram) showing the distribution of "Confidence". It is unimodal, peaking between 0.2 and 0.3.
* **Reference Line:** A faint, horizontal, dashed purple line is present at approximately y = 0.25, likely representing the median or mean confidence level.
### Detailed Analysis
* **Data Point Distribution:** The scatter plot contains several hundred data points (purple dots).
* **Spatial Grounding & Trend Verification:**
* The highest density of points is concentrated in the lower-left quadrant, where **Target Length is between 0-250** and **Confidence is between 0.1-0.4**.
* The overall visual trend shows a **weak negative correlation**. As Target Length increases, the cloud of points trends slightly downward, suggesting a potential decrease in Confidence.
* **Outliers:** There are a few notable outliers:
* A small cluster of points with very high Confidence (>0.6) at low Target Lengths (<100).
* A few points with moderate Confidence (~0.4-0.5) at higher Target Lengths (400-600).
* **Marginal Plot Details:**
* The **top histogram** confirms the right-skew: the vast majority of "Target Length" values are below 250, with a long tail extending to ~700.
* The **right density plot** confirms the concentration of "Confidence" values: the distribution peaks sharply around 0.25 and tapers off, with very few instances above 0.6.
### Key Observations
1. **Primary Cluster:** The core of the data lies in the region of short target lengths and low-to-moderate confidence.
2. **Inverse Relationship:** There is a visual suggestion that longer targets are associated with slightly lower confidence scores, though the relationship is not strong.
3. **High-Confidence Exceptions:** The presence of high-confidence points at very short lengths indicates that some "security_studies" items are deemed highly confident despite (or because of) their brevity.
4. **Central Tendency:** The horizontal reference line at ~0.25 aligns with the peak of the confidence density plot, indicating this is the most common confidence level.
### Interpretation
This chart likely analyzes the performance or characteristics of a model or system related to "security_studies". The "Target Length" could refer to the length of a text, a code snippet, or a sequence being analyzed, while "Confidence" represents the model's certainty in its output (e.g., classification, detection, or summary).
The data suggests that **the system is most frequently applied to, or performs most consistently on, shorter targets**, where it exhibits a baseline confidence around 0.25. The weak negative trend might imply that as the complexity or length of the target increases, the system's confidence in its assessment slightly diminishes, which is a common pattern in many AI tasks. The high-confidence outliers at short lengths could represent clear-cut, unambiguous cases that are easy for the system to evaluate. The overall distribution indicates that high-confidence assessments (>0.6) are rare for this category. This visualization would be crucial for understanding the operational envelope and reliability of a security-focused analytical tool.