## Scatter Plot with Marginal Histograms: security_studies
### Overview
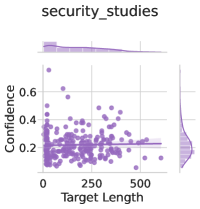
The image displays a scatter plot titled "security_studies" with marginal histograms on the top and right axes. The plot visualizes the relationship between "Target Length" (x-axis) and "Confidence" (y-axis), with data points represented as purple dots. The marginal histograms show the distribution of values along each axis.
### Components/Axes
- **Title**: "security_studies" (top-center, bold text).
- **X-axis (Target Length)**:
- Label: "Target Length" (bottom-left, horizontal axis).
- Scale: 0 to 500 (linear increments of ~25).
- **Y-axis (Confidence)**:
- Label: "Confidence" (left side, vertical axis).
- Scale: 0 to 0.6 (linear increments of ~0.1).
- **Marginal Histograms**:
- Top histogram: Distribution of "Target Length" (purple bars).
- Right histogram: Distribution of "Confidence" (purple bars).
- **Legend**: No explicit legend labels are present. The title "security_studies" may implicitly describe the dataset.
### Detailed Analysis
- **Scatter Plot**:
- Data points are clustered primarily between **Target Length = 100–300** and **Confidence = 0.2–0.4**.
- A few outliers exist, including one at **(500, 0.1)** (far right, low confidence).
- The marginal histograms confirm that:
- **Target Length** is skewed toward lower values (peak at ~200).
- **Confidence** is concentrated around **0.2–0.4**, with a long tail toward lower values.
### Key Observations
1. **Negative Correlation**: As "Target Length" increases, "Confidence" generally decreases (e.g., points near (500, 0.1) vs. (100, 0.5)).
2. **Outlier**: The point at **(500, 0.1)** deviates significantly from the main cluster, suggesting an anomaly or edge case.
3. **Distribution Skew**: Most data points fall within the lower ranges of both axes, indicating a focus on shorter targets and moderate confidence levels.
### Interpretation
The data suggests that in the context of "security_studies," longer target lengths are associated with lower confidence levels. This could imply that more complex or extended targets (e.g., security protocols, threat scenarios) are harder to achieve high confidence in. The outlier at (500, 0.1) may represent an exceptional case where a very long target resulted in minimal confidence, warranting further investigation. The marginal histograms reinforce that the dataset is dominated by shorter targets and moderate confidence, highlighting a potential bias or limitation in the studied scope.