## Diagram: Sound Source Localization Setup
### Overview
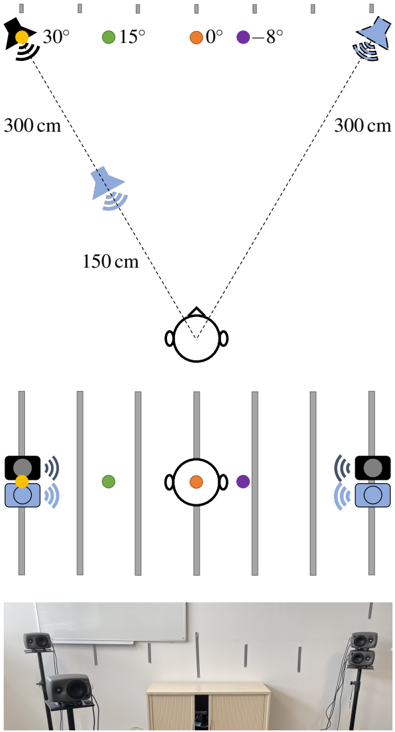
The image presents a diagram of a sound source localization setup, including a top-down schematic, a simplified representation, and a photograph of the physical setup. The diagram illustrates the positioning of speakers relative to a listener's head, with specific angles and distances indicated.
### Components/Axes
* **Top-Down Schematic:**
* Speakers: Represented by blue speaker icons.
* Listener: Represented by a head icon.
* Angles: 30°, 15°, 0°, -8° (indicated by colored dots: yellow, green, orange, purple respectively).
* Distances: 300 cm (distance from speakers to a central point), 150 cm (distance from the central point to the listener's head).
* **Simplified Representation:**
* Speakers: Represented by speaker icons with sound waves emanating from them.
* Listener: Represented by a head icon.
* Colored dots: Yellow, green, orange, and purple, corresponding to the angles in the top-down schematic.
* Vertical gray lines: Representing some form of physical barrier or marker.
* **Photograph:**
* Physical setup of speakers on stands.
* A cabinet or console in the background.
* Vertical gray tape markers on the wall, corresponding to the gray lines in the simplified representation.
### Detailed Analysis
* **Top-Down Schematic:**
* A speaker is positioned at approximately 30 degrees to the left of the listener, indicated by a yellow dot.
* A speaker is positioned at approximately 15 degrees to the left of the listener, indicated by a green dot.
* A speaker is positioned at 0 degrees (directly in front) of the listener, indicated by an orange dot.
* A speaker is positioned at approximately -8 degrees to the right of the listener, indicated by a purple dot.
* The distance from each speaker to a central point is 300 cm.
* The distance from the central point to the listener's head is 150 cm.
* **Simplified Representation:**
* The speakers are positioned behind vertical gray lines.
* The colored dots (yellow, green, orange, purple) indicate the relative positions of the sound sources.
* **Photograph:**
* The speakers are mounted on stands.
* The gray tape markers on the wall align with the speaker positions.
### Key Observations
* The diagram illustrates a controlled environment for sound localization experiments.
* The setup involves multiple speakers positioned at different angles relative to the listener.
* The distances and angles are precisely defined.
* The photograph provides a visual representation of the physical setup.
### Interpretation
The diagram depicts a sound source localization experiment setup. The top-down schematic provides a clear representation of the speaker positions and distances relative to the listener. The simplified representation and the photograph offer additional context, showing the physical arrangement of the speakers and the experimental environment. The use of colored dots to represent the angles helps to visually connect the different representations. The gray lines and tape markers likely serve as visual cues or barriers within the experiment. The setup is designed to allow for controlled testing of sound localization abilities under specific conditions.