\n
## Line Chart: I-Don't-Know Rate vs. Layer for Llama Models
### Overview
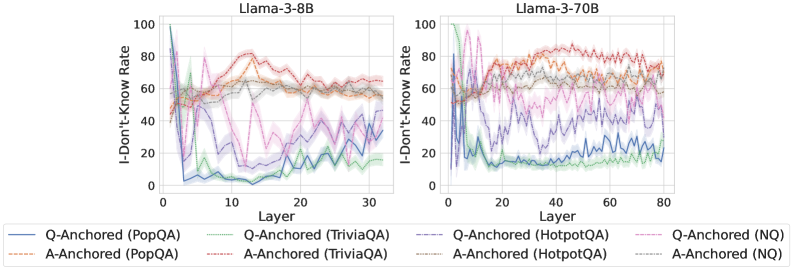
The image presents two line charts, side-by-side, displaying the "I-Don't-Know Rate" as a function of "Layer" for two different Llama models: Llama-3-8B and Llama-3-70B. Each chart contains multiple lines representing different question-answering datasets and anchoring methods. The charts aim to visualize how the rate of the model responding with "I-Don't-Know" changes across different layers of the neural network.
### Components/Axes
* **X-axis:** "Layer" - Ranges from 0 to approximately 30 for the Llama-3-8B chart and 0 to approximately 80 for the Llama-3-70B chart.
* **Y-axis:** "I-Don't-Know Rate" - Ranges from 0 to 100.
* **Models:** Llama-3-8B (left chart), Llama-3-70B (right chart).
* **Datasets/Anchoring Methods (Legend):**
* Q-Anchored (PopQA) - Blue solid line
* A-Anchored (PopQA) - Orange dashed line
* Q-Anchored (TriviaQA) - Purple solid line
* A-Anchored (TriviaQA) - Red dashed line
* Q-Anchored (HotpotQA) - Green dashed-dotted line
* A-Anchored (HotpotQA) - Gray solid line
* Q-Anchored (NQ) - Cyan solid line
* A-Anchored (NQ) - Magenta dashed line
### Detailed Analysis or Content Details
**Llama-3-8B Chart:**
* **Q-Anchored (PopQA):** Starts at approximately 90, rapidly decreases to around 20 by layer 5, then fluctuates between 20 and 40.
* **A-Anchored (PopQA):** Starts at approximately 80, decreases to around 50 by layer 5, then remains relatively stable between 50 and 70.
* **Q-Anchored (TriviaQA):** Starts at approximately 85, decreases to around 30 by layer 5, then fluctuates between 30 and 50.
* **A-Anchored (TriviaQA):** Starts at approximately 80, decreases to around 50 by layer 5, then remains relatively stable between 50 and 70.
* **Q-Anchored (HotpotQA):** Starts at approximately 80, decreases to around 20 by layer 5, then fluctuates between 20 and 40.
* **A-Anchored (HotpotQA):** Starts at approximately 75, decreases to around 40 by layer 5, then remains relatively stable between 40 and 60.
* **Q-Anchored (NQ):** Starts at approximately 70, decreases to around 15 by layer 5, then fluctuates between 15 and 30.
* **A-Anchored (NQ):** Starts at approximately 70, decreases to around 40 by layer 5, then remains relatively stable between 40 and 60.
**Llama-3-70B Chart:**
* **Q-Anchored (PopQA):** Starts at approximately 90, decreases to around 20 by layer 10, then fluctuates between 20 and 40.
* **A-Anchored (PopQA):** Starts at approximately 80, decreases to around 50 by layer 10, then remains relatively stable between 50 and 70.
* **Q-Anchored (TriviaQA):** Starts at approximately 85, decreases to around 30 by layer 10, then fluctuates between 30 and 50.
* **A-Anchored (TriviaQA):** Starts at approximately 80, decreases to around 50 by layer 10, then remains relatively stable between 50 and 70.
* **Q-Anchored (HotpotQA):** Starts at approximately 80, decreases to around 20 by layer 10, then fluctuates between 20 and 40.
* **A-Anchored (HotpotQA):** Starts at approximately 75, decreases to around 40 by layer 10, then remains relatively stable between 40 and 60.
* **Q-Anchored (NQ):** Starts at approximately 70, decreases to around 15 by layer 10, then fluctuates between 15 and 30.
* **A-Anchored (NQ):** Starts at approximately 70, decreases to around 40 by layer 10, then remains relatively stable between 40 and 60.
### Key Observations
* In both charts, all lines exhibit a steep initial decline in the "I-Don't-Know Rate" within the first 5-10 layers.
* After the initial decline, the lines tend to stabilize, fluctuating within a certain range.
* "A-Anchored" methods generally have higher "I-Don't-Know Rates" than "Q-Anchored" methods across all datasets.
* The "NQ" dataset consistently shows the lowest "I-Don't-Know Rate" among the "Q-Anchored" methods.
* The 70B model appears to exhibit similar trends to the 8B model, but extends to a larger number of layers.
### Interpretation
The charts demonstrate how the confidence of the Llama models (as measured by the "I-Don't-Know Rate") evolves as information propagates through the layers of the neural network. The initial steep decline suggests that the early layers are crucial for establishing a basic understanding of the input and reducing uncertainty. The subsequent stabilization indicates that further layers refine this understanding but do not significantly alter the overall confidence level.
The difference between "Q-Anchored" and "A-Anchored" methods suggests that the way the question or answer is presented influences the model's confidence. "A-Anchored" methods, which likely involve providing the answer context, lead to higher "I-Don't-Know Rates," potentially because the model is more cautious when presented with a potential answer.
The consistent performance of the "NQ" dataset with "Q-Anchored" methods could indicate that this dataset is particularly well-suited for the model's architecture or training process. The fact that the trends are similar between the 8B and 70B models suggests that increasing model size does not fundamentally change the underlying behavior, but rather extends the range over which this behavior is observed. The charts provide valuable insights into the internal workings of these language models and can inform strategies for improving their performance and reliability.