\n
## Comparative Line Charts: "I-Don't-Know Rate" Across Model Layers
### Overview
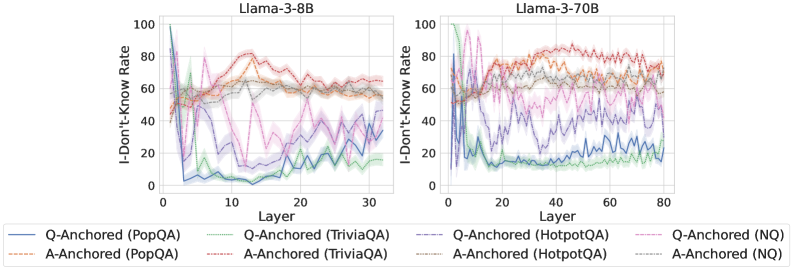
The image displays two side-by-side line charts comparing the "I-Don't-Know Rate" (y-axis) across different layers (x-axis) for two language models: **Llama-3-8B** (left panel) and **Llama-3-70B** (right panel). Each chart plots multiple data series representing different question-answering datasets, categorized by two anchoring methods: "Q-Anchored" and "A-Anchored."
### Components/Axes
* **Chart Titles (Top Center):**
* Left Panel: `Llama-3-8B`
* Right Panel: `Llama-3-70B`
* **Y-Axis (Left Side, Both Panels):**
* Label: `I-Don't-Know Rate`
* Scale: 0 to 100, with major tick marks at 0, 20, 40, 60, 80, 100.
* **X-Axis (Bottom, Both Panels):**
* Label: `Layer`
* Scale (Llama-3-8B): 0 to 30, with major tick marks at 0, 10, 20, 30.
* Scale (Llama-3-70B): 0 to 80, with major tick marks at 0, 20, 40, 60, 80.
* **Legend (Bottom Center, spanning both charts):**
* Positioned below the x-axis labels.
* Contains 8 entries, organized in two rows of four.
* **Row 1 (Q-Anchored):**
* Solid Blue Line: `Q-Anchored (PopQA)`
* Solid Green Line: `Q-Anchored (TriviaQA)`
* Dashed Purple Line: `Q-Anchored (HotpotQA)`
* Dashed Pink Line: `Q-Anchored (NQ)`
* **Row 2 (A-Anchored):**
* Dashed Orange Line: `A-Anchored (PopQA)`
* Dashed Red Line: `A-Anchored (TriviaQA)`
* Dashed Gray Line: `A-Anchored (HotpotQA)`
* Dashed Light Blue Line: `A-Anchored (NQ)`
### Detailed Analysis
**Llama-3-8B Chart (Left Panel):**
* **Q-Anchored Series (Solid Lines):** All four series show a dramatic, steep decline from a high initial rate (near 80-100) within the first 5 layers, dropping to between 0-40. After this initial drop, they exhibit significant volatility, fluctuating between approximately 10 and 50 for the remaining layers (5-30). The `Q-Anchored (PopQA)` (solid blue) line ends near 40, while `Q-Anchored (TriviaQA)` (solid green) ends near 20.
* **A-Anchored Series (Dashed Lines):** These series start lower (around 40-60) and show a general upward trend or stability in the early layers (0-15), peaking between 60-80. After layer 15, they trend slightly downward or stabilize, ending in the 40-70 range. The `A-Anchored (TriviaQA)` (dashed red) line shows one of the highest sustained rates, peaking above 80 around layer 12.
**Llama-3-70B Chart (Right Panel):**
* **Q-Anchored Series (Solid Lines):** Similar to the 8B model, these series start high and drop sharply in the first ~10 layers. However, the post-drop behavior is different. They stabilize at a lower level (mostly between 10-30) with less extreme volatility compared to the 8B model. The `Q-Anchored (PopQA)` (solid blue) line settles around 20-30.
* **A-Anchored Series (Dashed Lines):** These series show a more pronounced and sustained increase in the "I-Don't-Know Rate" across the first 40-50 layers, often reaching and maintaining levels between 70-90. The `A-Anchored (TriviaQA)` (dashed red) and `A-Anchored (PopQA)` (dashed orange) lines are particularly high, frequently above 80. After layer 50, they show a slight decline but remain high (60-80).
### Key Observations
1. **Anchoring Method Dichotomy:** There is a clear and consistent separation between Q-Anchored and A-Anchored series across both models. Q-Anchored methods lead to a rapid decrease in the "I-Don't-Know Rate" early in the network, while A-Anchored methods lead to an increase or maintenance of a higher rate.
2. **Model Size Effect:** The larger Llama-3-70B model exhibits more pronounced and stable trends. The A-Anchored rates climb higher and stay higher for longer, and the Q-Anchored rates stabilize at a lower, less volatile level compared to the 8B model.
3. **Dataset Variation:** Within each anchoring category, different datasets (PopQA, TriviaQA, HotpotQA, NQ) follow similar general trends but with distinct offsets and volatility. For example, `A-Anchored (TriviaQA)` (dashed red) consistently shows among the highest rates in both models.
4. **Layer Sensitivity:** The most significant changes for all series occur in the first quarter of the layers (0-10 for 8B, 0-20 for 70B), indicating these early-to-mid layers are critical for the model's calibration of uncertainty.
### Interpretation
The data suggests a fundamental difference in how the model processes questions versus answers when calibrating its uncertainty ("I-Don't-Know" response).
* **Q-Anchored (Question-Anchored):** When the model's processing is anchored to the question, it appears to rapidly gain confidence (or reduce its stated uncertainty) in the early layers. This could indicate that the model quickly extracts features from the question that allow it to commit to an answer path, reducing its propensity to say "I don't know."
* **A-Anchored (Answer-Anchored):** When anchored to the answer, the model's uncertainty increases or remains high through many more layers. This suggests that evaluating or generating an answer requires more sustained processing and perhaps more internal "deliberation," leading to a higher reported uncertainty rate for a longer portion of the network depth.
The difference between the 8B and 70B models implies that larger models develop more distinct and stable internal pathways for handling question vs. answer context. The higher, more sustained uncertainty in the A-Anchored 70B model might reflect a more nuanced or cautious evaluation process when an answer is in focus. The consistent ranking of datasets (e.g., TriviaQA often highest) suggests some datasets are inherently more challenging or elicit more uncertainty from the model under these anchoring conditions. This analysis provides insight into the internal mechanics of large language models, showing how the point of focus (question vs. answer) dramatically shapes the model's expressed confidence across its layers.