## Line Graph: I-Don't-Know Rate Across Llama-3 Model Sizes and Anchoring Methods
### Overview
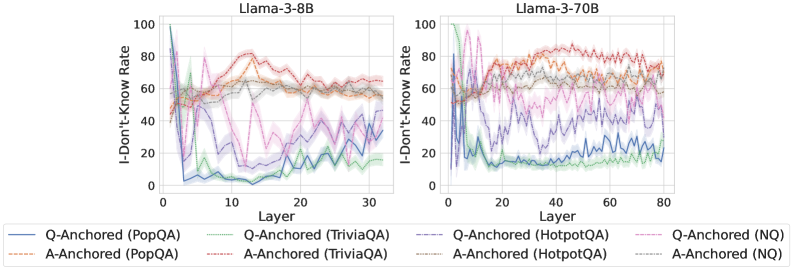
The image contains two line graphs comparing the "I-Don't-Know Rate (%)" across layers of two Llama-3 language models (8B and 70B parameters). Each graph shows six data series representing different question-answering datasets (PopQA, TriviaQA, HotpotQA, NQ) and anchoring methods (Q-Anchored vs. A-Anchored). The graphs reveal layer-dependent performance variations and dataset-specific behaviors.
### Components/Axes
- **X-Axis (Layer)**:
- Llama-3-8B: 0–30 (discrete increments)
- Llama-3-70B: 0–80 (discrete increments)
- **Y-Axis (I-Don't-Know Rate)**: 0–100% (continuous scale)
- **Legends**:
- **Llama-3-8B**:
- Solid blue: Q-Anchored (PopQA)
- Dashed orange: A-Anchored (PopQA)
- Solid green: Q-Anchored (TriviaQA)
- Dashed red: A-Anchored (TriviaQA)
- Solid purple: Q-Anchored (HotpotQA)
- Dashed gray: A-Anchored (HotpotQA)
- **Llama-3-70B**:
- Solid blue: Q-Anchored (PopQA)
- Dashed orange: A-Anchored (PopQA)
- Solid green: Q-Anchored (TriviaQA)
- Dashed red: A-Anchored (TriviaQA)
- Solid purple: Q-Anchored (HotpotQA)
- Dashed gray: A-Anchored (HotpotQA)
- Solid pink: Q-Anchored (NQ)
- Dashed gray: A-Anchored (NQ)
### Detailed Analysis
#### Llama-3-8B
- **Q-Anchored (PopQA)**: Starts at ~85% in Layer 0, drops sharply to ~20% by Layer 10, then fluctuates between 10–30%.
- **A-Anchored (PopQA)**: Begins at ~60%, rises to ~80% by Layer 5, then stabilizes around 60–70%.
- **Q-Anchored (TriviaQA)**: Peaks at ~70% in Layer 0, declines to ~30% by Layer 20, with oscillations.
- **A-Anchored (TriviaQA)**: Starts at ~50%, rises to ~75% by Layer 10, then declines to ~50%.
- **Q-Anchored (HotpotQA)**: Sharp drop from ~90% to ~10% by Layer 5, then stabilizes near 10%.
- **A-Anchored (HotpotQA)**: Begins at ~70%, fluctuates between 50–80% throughout.
#### Llama-3-70B
- **Q-Anchored (PopQA)**: Starts at ~70%, drops to ~30% by Layer 20, then stabilizes.
- **A-Anchored (PopQA)**: Begins at ~50%, rises to ~70% by Layer 40, then declines.
- **Q-Anchored (TriviaQA)**: Peaks at ~80% in Layer 0, declines to ~40% by Layer 60.
- **A-Anchored (TriviaQA)**: Starts at ~60%, rises to ~85% by Layer 40, then stabilizes.
- **Q-Anchored (HotpotQA)**: Sharp drop from ~95% to ~20% by Layer 10, then stabilizes.
- **A-Anchored (HotpotQA)**: Begins at ~60%, fluctuates between 40–70%.
- **Q-Anchored (NQ)**: Starts at ~60%, drops to ~20% by Layer 20, then stabilizes.
- **A-Anchored (NQ)**: Begins at ~40%, rises to ~60% by Layer 60, then declines.
### Key Observations
1. **Model Size Impact**: Llama-3-70B shows more pronounced oscillations and higher initial I-Don't-Know rates compared to the 8B model.
2. **Anchoring Method**:
- Q-Anchored methods generally show steeper initial declines but stabilize at lower rates.
- A-Anchored methods exhibit higher variability but maintain higher rates in later layers.
3. **Dataset Sensitivity**:
- HotpotQA (complex reasoning) shows the most dramatic drops for Q-Anchored methods.
- NQ (common knowledge) exhibits the least variability in the 70B model.
4. **Layer Dependency**: Both models show significant performance shifts in early layers (0–20), with stabilization in later layers.
### Interpretation
The data suggests that anchoring methods (Q vs. A) differentially affect model uncertainty across datasets and model sizes. Larger models (70B) exhibit greater sensitivity to anchoring choices, particularly in early layers. The steep declines in Q-Anchored methods for complex datasets (HotpotQA) imply that explicit question anchoring reduces uncertainty more effectively for challenging tasks. However, A-Anchored methods maintain higher uncertainty in later layers, potentially indicating over-reliance on answer patterns. The stabilization of rates in later layers across both models suggests that deeper layers achieve more consistent performance, though the 70B model's oscillations highlight trade-offs between scale and stability.