## Line Chart: Test Error vs. Alpha for ReLU and ELU
### Overview
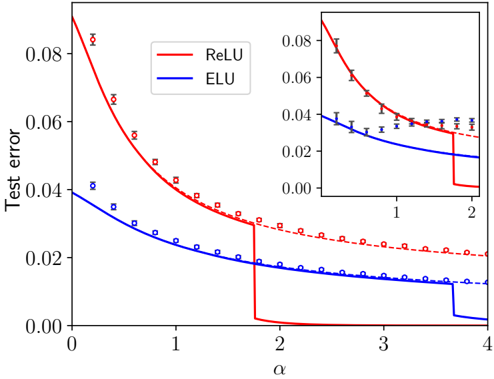
The image presents a line chart comparing the test error of two activation functions, ReLU (Rectified Linear Unit) and ELU (Exponential Linear Unit), as a function of a parameter α (alpha). The chart displays the test error on the y-axis and α on the x-axis. A zoomed-in section of the chart is included in the top-right corner, focusing on the range of α from 0 to 2. Error bars are present for each data point, indicating the variability or uncertainty in the test error measurements.
### Components/Axes
* **X-axis:** Labeled "α" (alpha), ranging from approximately 0 to 4.
* **Y-axis:** Labeled "Test error", ranging from approximately 0 to 0.08.
* **Legend:** Located in the top-right corner, identifying the two lines:
* ReLU (represented by a red solid line)
* ELU (represented by a blue solid line)
* **Data Points:** Represented by markers along each line. ReLU is marked with red squares, and ELU is marked with blue squares.
* **Error Bars:** Vertical lines extending above and below each data point, indicating the standard deviation or confidence interval.
* **Inset Chart:** A zoomed-in view of the chart, focusing on the range of α from 0 to 2.
### Detailed Analysis
**ReLU (Red Line):**
The ReLU line starts at approximately 0.075 at α = 0. It generally decreases as α increases, but exhibits a sharp drop to approximately 0.005 at α = 2. After α = 2, the line remains relatively constant at around 0.005.
* α = 0: Test error ≈ 0.075 ± 0.003
* α = 0.5: Test error ≈ 0.06 ± 0.003
* α = 1: Test error ≈ 0.05 ± 0.003
* α = 1.5: Test error ≈ 0.035 ± 0.003
* α = 2: Test error ≈ 0.005 ± 0.001
* α = 3: Test error ≈ 0.005 ± 0.001
* α = 4: Test error ≈ 0.005 ± 0.001
**ELU (Blue Line):**
The ELU line starts at approximately 0.045 at α = 0. It consistently decreases as α increases, reaching a minimum of approximately 0.015 at α = 4.
* α = 0: Test error ≈ 0.045 ± 0.002
* α = 0.5: Test error ≈ 0.035 ± 0.002
* α = 1: Test error ≈ 0.025 ± 0.002
* α = 1.5: Test error ≈ 0.02 ± 0.002
* α = 2: Test error ≈ 0.017 ± 0.001
* α = 3: Test error ≈ 0.016 ± 0.001
* α = 4: Test error ≈ 0.015 ± 0.001
**Inset Chart:**
The inset chart provides a more detailed view of the initial portion of the curves. It confirms the trends observed in the main chart, showing the initial decrease in test error for both ReLU and ELU.
### Key Observations
* ReLU exhibits a significant drop in test error at α = 2, while ELU shows a more gradual decrease.
* For α values greater than 2, ReLU maintains a much lower test error compared to ELU.
* ELU consistently has a lower test error than ReLU for α values less than 2.
* The error bars suggest that the measurements for both ReLU and ELU have similar levels of uncertainty.
### Interpretation
The chart demonstrates the impact of the α parameter on the test error of ReLU and ELU activation functions. The sharp decrease in ReLU's test error at α = 2 suggests a critical point where the activation function's behavior changes significantly, potentially leading to improved performance. The consistent decrease in ELU's test error indicates a more stable and predictable behavior across the range of α values. The difference in performance between the two functions highlights the importance of choosing the appropriate activation function and parameter settings for a given task. The inset chart is useful for understanding the initial behavior of the functions, where the differences are more pronounced. The error bars indicate the reliability of the measurements, suggesting that the observed differences are statistically significant. The data suggests that for α > 2, ReLU is the preferred activation function, while for α < 2, ELU may be more suitable.