## Line Chart: Test Error vs. Alpha Parameter for ReLU and ELU Activation Functions
### Overview
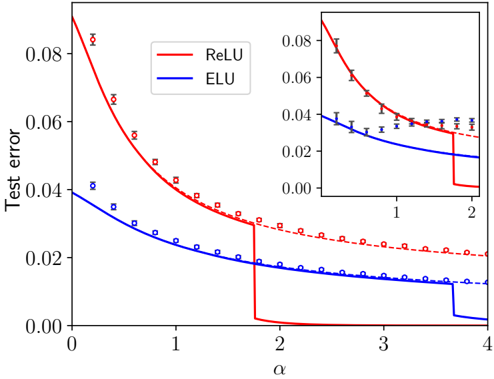
The chart compares the test error performance of two activation functions (ReLU and ELU) across varying alpha (α) values. Two lines represent the test error trends, with ReLU (red) showing a steeper initial decline and ELU (blue) exhibiting a more gradual decrease. An inset graph zooms into the α range [1, 2] for finer detail.
### Components/Axes
- **X-axis (α)**: Ranges from 0 to 4, labeled "α".
- **Y-axis (Test Error)**: Ranges from 0.00 to 0.08, labeled "Test error".
- **Legend**: Located in the top-right corner, associating:
- **Red solid line**: ReLU activation function.
- **Blue dashed line**: ELU activation function.
- **Data Points**:
- ReLU: Red squares with error bars.
- ELU: Blue circles with error bars.
- **Inset Graph**: Focuses on α ∈ [1, 2], with the same axes and data styles.
### Detailed Analysis
1. **ReLU (Red Line)**:
- At α = 0: Test error ≈ 0.08 (error bar ±0.005).
- At α = 1: Test error ≈ 0.06 (error bar ±0.003).
- At α = 2: Test error ≈ 0.04 (error bar ±0.002).
- At α = 3: Test error ≈ 0.02 (error bar ±0.001).
- At α = 4: Test error ≈ 0.01 (error bar ±0.001).
- **Trend**: Steep decline from α = 0 to α = 2, then plateaus.
2. **ELU (Blue Line)**:
- At α = 0: Test error ≈ 0.04 (error bar ±0.003).
- At α = 1: Test error ≈ 0.03 (error bar ±0.002).
- At α = 2: Test error ≈ 0.02 (error bar ±0.001).
- At α = 3: Test error ≈ 0.015 (error bar ±0.001).
- At α = 4: Test error ≈ 0.01 (error bar ±0.001).
- **Trend**: Gradual decline across all α values, with smaller error bars.
3. **Inset Graph (α ∈ [1, 2])**:
- ReLU: Test error decreases from ~0.06 (α=1) to ~0.04 (α=2), with error bars shrinking from ±0.003 to ±0.002.
- ELU: Test error decreases from ~0.03 (α=1) to ~0.02 (α=2), with error bars shrinking from ±0.002 to ±0.001.
### Key Observations
- **ReLU vs. ELU**: ReLU starts with higher test error but converges toward ELU as α increases. Both functions plateau near α = 3–4.
- **Error Bar Variability**: ReLU’s error bars are consistently larger than ELU’s, suggesting greater uncertainty in ReLU’s measurements, especially at lower α values.
- **Inset Precision**: The zoomed-in view confirms that ELU maintains lower test error and tighter confidence intervals in the α ∈ [1, 2] range.
### Interpretation
The data suggests that ELU generally provides more stable and reliable performance across α values, with smaller test errors and lower uncertainty. ReLU’s steeper initial decline indicates sensitivity to α tuning, but its larger error bars imply potential instability or overfitting risks at lower α values. The convergence of both functions at higher α values (α ≥ 3) suggests that increasing α beyond this point yields diminishing returns. The inset highlights that ELU’s advantages are most pronounced in the α ∈ [1, 2] range, where it maintains a consistent edge over ReLU. This could inform activation function selection in neural network design, favoring ELU for scenarios prioritizing stability and generalization.