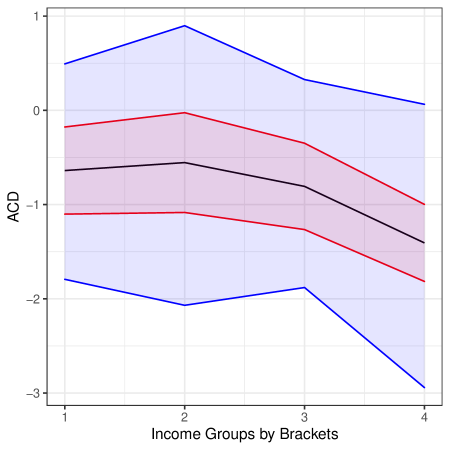
## Line Chart: ACD vs. Income Groups by Brackets
### Overview
The image is a line chart displaying the relationship between ACD (likely an acronym for a measured variable) and Income Groups by Brackets. The chart includes a central black line representing the mean ACD value for each income group, a red shaded area indicating the standard error, and a blue shaded area indicating the standard deviation. The x-axis represents income groups, and the y-axis represents the ACD value.
### Components/Axes
* **X-axis:** "Income Groups by Brackets" with tick marks at 1, 2, 3, and 4.
* **Y-axis:** "ACD" with tick marks at -3, -2, -1, 0, and 1.
* **Mean:** Represented by a solid black line.
* **Standard Error:** Represented by a red shaded area around the mean.
* **Standard Deviation:** Represented by a blue shaded area around the mean.
### Detailed Analysis
* **Mean (Black Line):**
* At Income Group 1, the mean ACD is approximately -0.4.
* At Income Group 2, the mean ACD is approximately -0.3.
* At Income Group 3, the mean ACD is approximately -0.6.
* At Income Group 4, the mean ACD is approximately -1.4.
* Trend: The mean ACD is relatively stable between income groups 1 and 3, then decreases significantly at income group 4.
* **Standard Error (Red Shaded Area):**
* The red shaded area represents the standard error around the mean.
* At Income Group 1, the standard error ranges from approximately -0.2 to -1.2.
* At Income Group 2, the standard error ranges from approximately 0 to -1.1.
* At Income Group 3, the standard error ranges from approximately -0.2 to -1.4.
* At Income Group 4, the standard error ranges from approximately -0.8 to -2.0.
* Trend: The standard error appears to widen slightly as income group increases.
* **Standard Deviation (Blue Shaded Area):**
* The blue shaded area represents the standard deviation around the mean.
* At Income Group 1, the standard deviation ranges from approximately 0.4 to -1.8.
* At Income Group 2, the standard deviation ranges from approximately 0.9 to -2.1.
* At Income Group 3, the standard deviation ranges from approximately 0.3 to -1.9.
* At Income Group 4, the standard deviation ranges from approximately 0.1 to -2.9.
* Trend: The standard deviation appears to be relatively consistent across income groups, with a slight decrease at income group 4.
### Key Observations
* The mean ACD decreases as income group increases, particularly at income group 4.
* The standard error and standard deviation provide a measure of the variability of ACD within each income group.
* The standard deviation is larger than the standard error, as expected.
### Interpretation
The chart suggests that there is a relationship between income group and ACD. Specifically, as income group increases, the average ACD tends to decrease. The standard error and standard deviation indicate the degree of variability in ACD within each income group. The significant drop in ACD at income group 4 suggests that this income bracket may be associated with a different ACD pattern compared to the lower income groups. Further analysis would be needed to determine the statistical significance of these trends and the underlying factors driving the relationship between income group and ACD.