## Scatter Plot: Model Size vs Average Reasoning and Capability Accuracy
### Overview
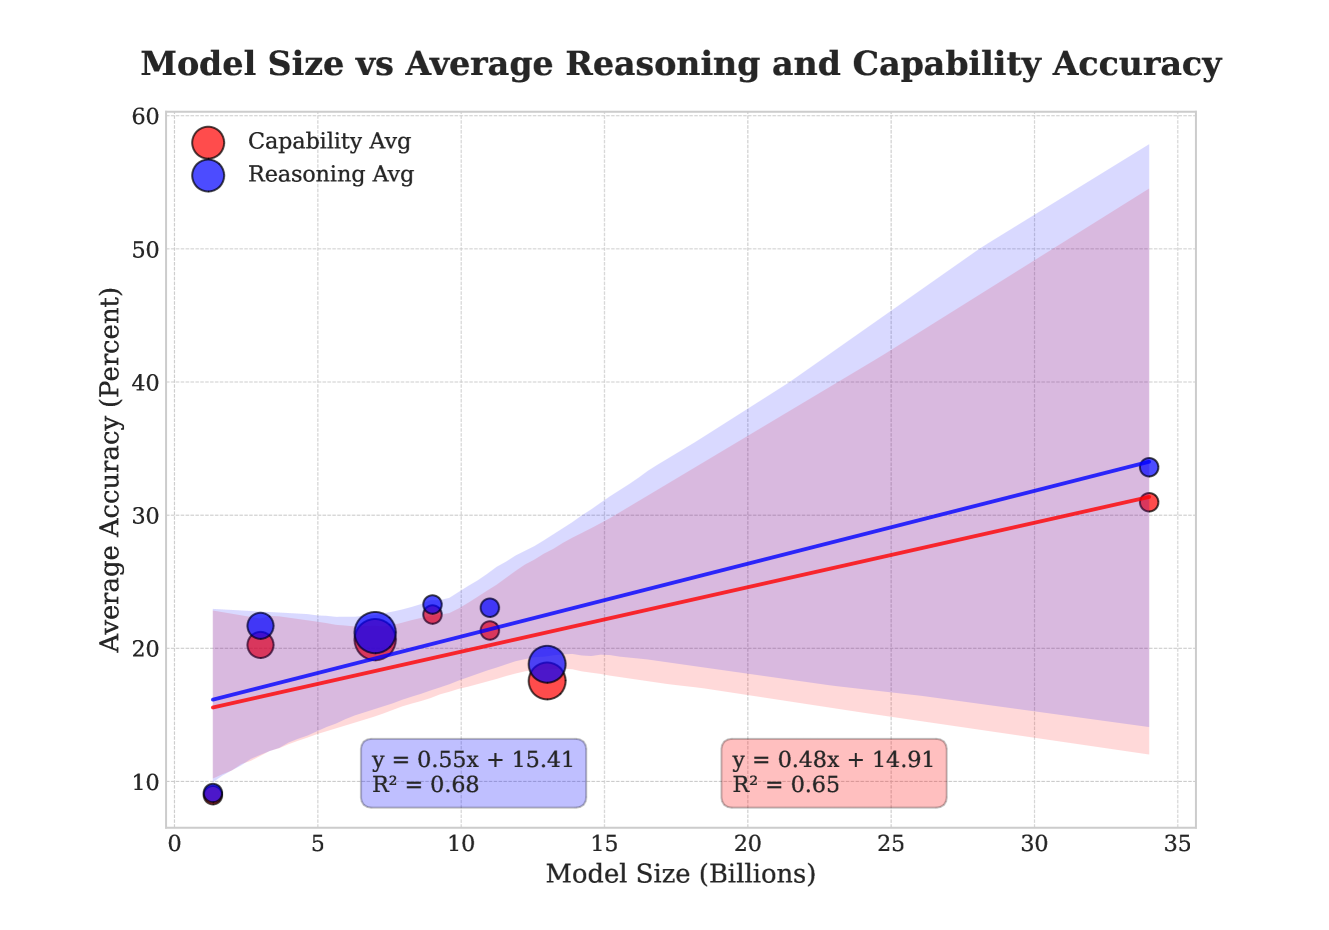
The image is a scatter plot comparing model size (in billions) to average accuracy (in percent) for both reasoning and capability. The plot includes trend lines with equations and R-squared values, along with shaded regions indicating confidence intervals. Data points are represented by circles, with the size of the circle potentially indicating another dimension of data.
### Components/Axes
* **Title:** Model Size vs Average Reasoning and Capability Accuracy
* **X-axis:** Model Size (Billions), with tick marks at 0, 5, 10, 15, 20, 25, 30, and 35.
* **Y-axis:** Average Accuracy (Percent), with tick marks at 10, 20, 30, 40, 50, and 60.
* **Legend:** Located in the top-left corner.
* Red circle: Capability Avg
* Blue circle: Reasoning Avg
* **Trend Lines:**
* Red line: Represents the trend for Capability Avg. Equation: y = 0.48x + 14.91, R² = 0.65.
* Blue line: Represents the trend for Reasoning Avg. Equation: y = 0.55x + 15.41, R² = 0.68.
* **Confidence Intervals:** Shaded regions around the trend lines.
* Light red shading around the red (Capability Avg) trend line.
* Light blue shading around the blue (Reasoning Avg) trend line.
### Detailed Analysis
* **Capability Avg (Red):**
* Trend: The red line slopes upward, indicating a positive correlation between model size and capability accuracy.
* Equation: y = 0.48x + 14.91
* R²: 0.65
* Data Points:
* At x=2, y ≈ 21
* At x=9, y ≈ 23
* At x=14, y ≈ 18
* At x=34, y ≈ 32
* **Reasoning Avg (Blue):**
* Trend: The blue line slopes upward, indicating a positive correlation between model size and reasoning accuracy.
* Equation: y = 0.55x + 15.41
* R²: 0.68
* Data Points:
* At x=1, y ≈ 9
* At x=4, y ≈ 21
* At x=9, y ≈ 23
* At x=14, y ≈ 19
* At x=34, y ≈ 34
### Key Observations
* Both capability and reasoning accuracy generally increase with model size.
* The reasoning accuracy (blue line) has a slightly steeper slope (0.55) than the capability accuracy (red line) (0.48), suggesting that reasoning ability benefits slightly more from increased model size.
* The R-squared values (0.68 for reasoning and 0.65 for capability) indicate that the linear models explain a moderate amount of the variance in the data.
* The size of the data points varies, suggesting another variable is being represented.
### Interpretation
The data suggests that increasing the size of a model generally leads to improvements in both its reasoning and capability accuracy. The slightly higher slope for reasoning accuracy indicates that model size may be more critical for enhancing reasoning abilities compared to general capabilities. The R-squared values suggest that while model size is a factor, other variables not captured in this plot also influence accuracy. The varying sizes of the data points could represent factors such as training data size, architecture variations, or other hyperparameters, which would provide a more complete picture of the factors influencing model performance.