## Scatter Plot: Model Size vs Average Reasoning and Capability Accuracy
### Overview
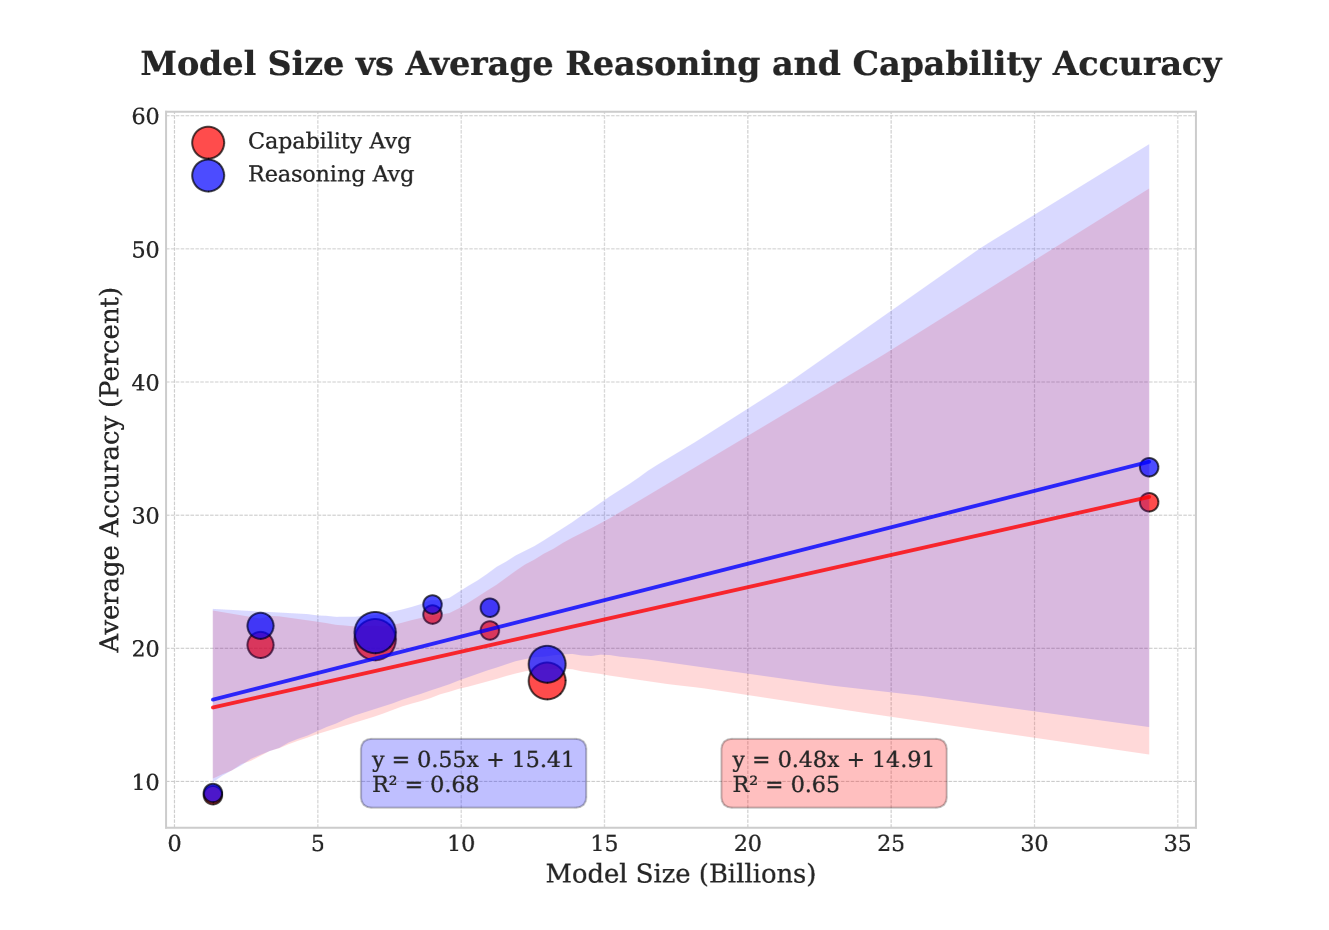
The image displays a scatter plot illustrating the relationship between "Model Size (Billions)" and "Average Accuracy (Percent)" for two distinct metrics: "Capability Avg" and "Reasoning Avg." The chart includes regression lines and shaded confidence intervals for both metrics to visualize the trend and uncertainty as model size increases.
### Components/Axes
* **X-Axis:** Labeled "Model Size (Billions)". The scale ranges from 0 to 35, with major grid lines at intervals of 5.
* **Y-Axis:** Labeled "Average Accuracy (Percent)". The scale ranges from 0 to 60, with major grid lines at intervals of 10.
* **Legend (Top-Left):**
* **Red Circle:** Represents "Capability Avg".
* **Blue Circle:** Represents "Reasoning Avg".
* **Regression Equations (Bottom-Center/Right):**
* **Blue Box (Reasoning):** $y = 0.55x + 15.41$, $R^2 = 0.68$
* **Red Box (Capability):** $y = 0.48x + 14.91$, $R^2 = 0.65$
### Detailed Analysis
* **Trend Verification:** Both data series exhibit a positive linear correlation. As the model size (X-axis) increases, the average accuracy (Y-axis) generally increases.
* **Data Series - Reasoning (Blue):**
* **Trend:** The blue regression line slopes upward, starting at approximately 16% accuracy at 0B parameters and reaching approximately 34% accuracy at 34B parameters.
* **Confidence Interval:** The blue shaded region represents the confidence interval for the Reasoning metric. It is relatively narrow at the lower end (0B–5B) and expands significantly as the model size increases, indicating higher uncertainty at larger scales.
* **Data Series - Capability (Red):**
* **Trend:** The red regression line slopes upward, starting at approximately 15% accuracy at 0B parameters and reaching approximately 31% accuracy at 34B parameters.
* **Confidence Interval:** The red shaded region represents the confidence interval for the Capability metric. Similar to the blue interval, it widens as model size increases, though it remains slightly narrower than the blue interval at the high end.
* **Data Point Distribution:**
* There are seven distinct clusters of data points along the X-axis (approx. 1.5B, 3B, 7B, 9B, 11B, 13B, and 34B).
* The points at 13B represent a notable deviation, where both Reasoning and Capability accuracy drop compared to the trend lines.
### Key Observations
* **Performance Gap:** The blue regression line (Reasoning) is consistently positioned above the red regression line (Capability) across the entire X-axis range, suggesting that Reasoning accuracy is generally higher than Capability accuracy for models of similar sizes.
* **Scaling Efficiency:** The slope of the Reasoning line (0.55) is steeper than the slope of the Capability line (0.48), indicating that Reasoning accuracy improves at a slightly faster rate relative to model size increases.
* **Correlation Strength:** The $R^2$ values (0.68 for Reasoning, 0.65 for Capability) indicate a moderate positive correlation. This suggests that while model size is a significant predictor of accuracy, it is not the sole determinant; other factors (e.g., training data quality, architecture) likely influence the results.
* **Uncertainty:** The widening confidence intervals (the "fan" shape) indicate that as models grow larger, the variance in performance becomes more pronounced, or there is less data available at the higher end of the parameter scale to constrain the prediction.
### Interpretation
The data demonstrates a clear, positive relationship between model size and performance in both Reasoning and Capability metrics. However, the moderate $R^2$ values suggest that "bigger is better" is a general rule rather than an absolute guarantee, as evidenced by the performance dip at the 13B parameter mark.
The widening confidence intervals at higher parameter counts suggest that as models scale, performance becomes less predictable. This could imply that larger models are more sensitive to training variations or that the dataset used for this chart has fewer samples at the high end, leading to less statistical certainty. The fact that Reasoning scales slightly better than Capability suggests that the architectural or training improvements applied to these models may be disproportionately benefiting reasoning tasks.