\n
## Scatter Plot: Model Size vs Average Reasoning and Capability Accuracy
### Overview
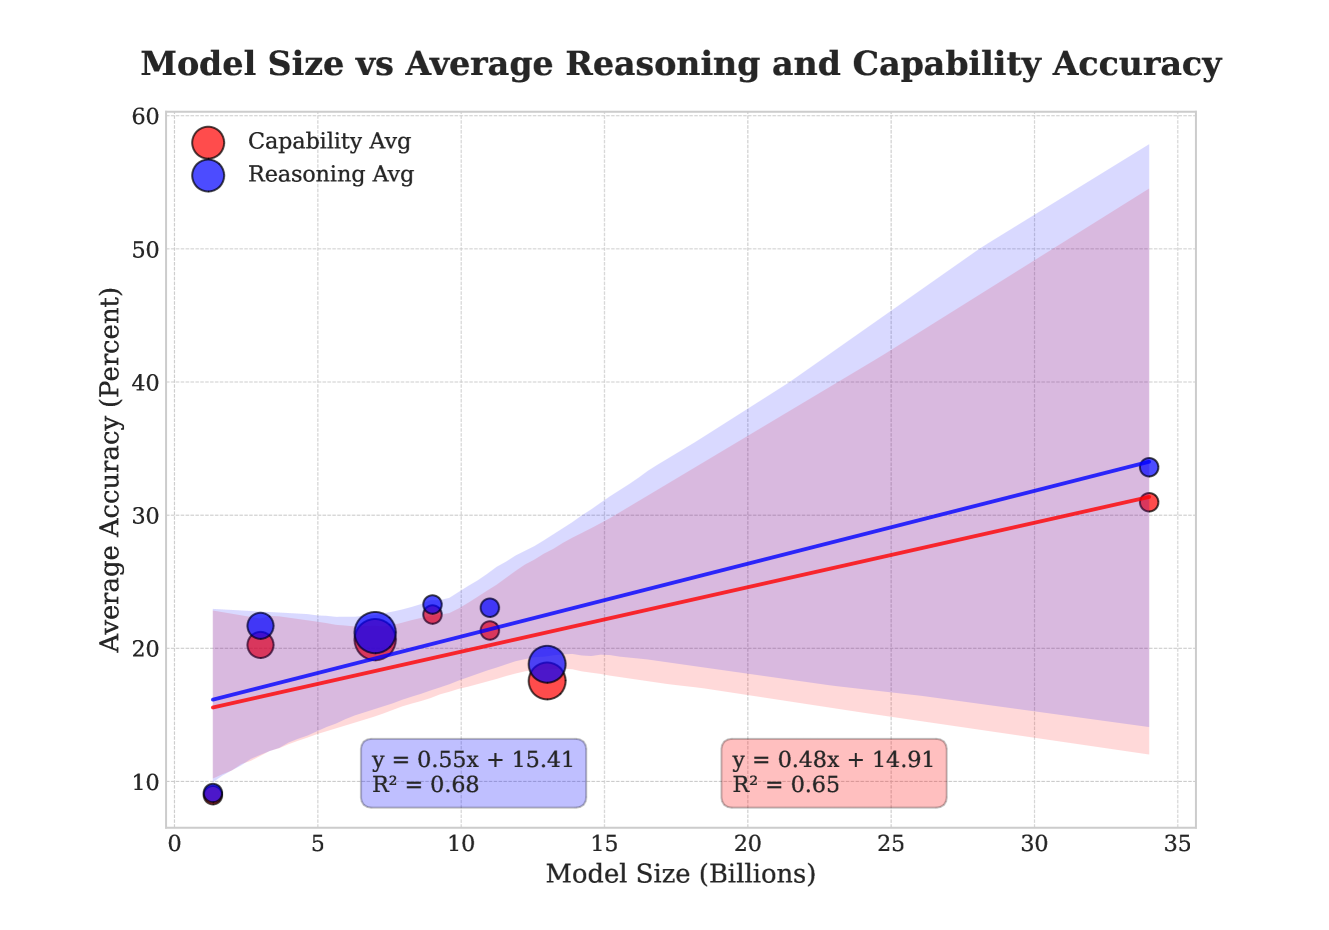
This image presents a scatter plot illustrating the relationship between Model Size (in Billions) and Average Accuracy (in Percent) for both Capability and Reasoning. Two linear regression lines are plotted, one for each category, along with confidence intervals represented by shaded regions.
### Components/Axes
* **Title:** "Model Size vs Average Reasoning and Capability Accuracy" (Top-center)
* **X-axis:** "Model Size (Billions)" - Scale ranges from 0 to 35.
* **Y-axis:** "Average Accuracy (Percent)" - Scale ranges from 10 to 60.
* **Legend:** Located in the top-left corner.
* Red circles: "Capability Avg"
* Blue circles: "Reasoning Avg"
* **Regression Equations & R-squared Values:** Two sets of equations and R-squared values are displayed along the bottom of the chart.
* For Capability Avg: y = 0.55x + 15.41, R² = 0.68
* For Reasoning Avg: y = 0.48x + 14.91, R² = 0.65
### Detailed Analysis
**Capability Avg (Red Line):**
The red line representing Capability Avg slopes upward, indicating a positive correlation between Model Size and Average Accuracy.
* At Model Size ≈ 0 Billion, Average Accuracy ≈ 15.4%.
* At Model Size ≈ 5 Billion, Average Accuracy ≈ 18.15% (15.41 + 0.55 * 5).
* At Model Size ≈ 10 Billion, Average Accuracy ≈ 20.9% (15.41 + 0.55 * 10).
* At Model Size ≈ 15 Billion, Average Accuracy ≈ 23.65% (15.41 + 0.55 * 15).
* At Model Size ≈ 20 Billion, Average Accuracy ≈ 26.4% (15.41 + 0.55 * 20).
* At Model Size ≈ 25 Billion, Average Accuracy ≈ 29.15% (15.41 + 0.55 * 25).
* At Model Size ≈ 30 Billion, Average Accuracy ≈ 31.9% (15.41 + 0.55 * 30).
* At Model Size ≈ 35 Billion, Average Accuracy ≈ 34.65% (15.41 + 0.55 * 35).
**Reasoning Avg (Blue Line):**
The blue line representing Reasoning Avg also slopes upward, indicating a positive correlation between Model Size and Average Accuracy, but with a slightly less steep slope than the Capability Avg line.
* At Model Size ≈ 0 Billion, Average Accuracy ≈ 14.91%.
* At Model Size ≈ 5 Billion, Average Accuracy ≈ 17.31% (14.91 + 0.48 * 5).
* At Model Size ≈ 10 Billion, Average Accuracy ≈ 19.71% (14.91 + 0.48 * 10).
* At Model Size ≈ 15 Billion, Average Accuracy ≈ 22.11% (14.91 + 0.48 * 15).
* At Model Size ≈ 20 Billion, Average Accuracy ≈ 24.51% (14.91 + 0.48 * 20).
* At Model Size ≈ 25 Billion, Average Accuracy ≈ 26.91% (14.91 + 0.48 * 25).
* At Model Size ≈ 30 Billion, Average Accuracy ≈ 29.31% (14.91 + 0.48 * 30).
* At Model Size ≈ 35 Billion, Average Accuracy ≈ 31.71% (14.91 + 0.48 * 35).
**Data Points:**
The scatter plot shows individual data points for both Capability and Reasoning. The points generally cluster around the respective regression lines.
### Key Observations
* Both Capability Avg and Reasoning Avg show a positive correlation with Model Size.
* Capability Avg consistently demonstrates higher accuracy than Reasoning Avg across all model sizes.
* The R-squared values (0.68 for Capability and 0.65 for Reasoning) indicate that approximately 65-68% of the variance in Average Accuracy can be explained by Model Size.
* The confidence intervals (shaded regions) around the regression lines indicate the uncertainty in the predicted accuracy. The intervals widen as Model Size increases, suggesting greater uncertainty in predictions for larger models.
### Interpretation
The data suggests that increasing Model Size generally leads to improved Average Accuracy for both Capability and Reasoning tasks. However, the relationship is not perfect, as evidenced by the R-squared values less than 1. The higher accuracy observed for Capability Avg compared to Reasoning Avg suggests that Capability tasks may benefit more from increased model size, or that the models are inherently better at Capability tasks. The widening confidence intervals at larger model sizes indicate that the benefits of further increasing model size may diminish, and the uncertainty in performance increases. This could be due to factors not accounted for in the model, such as data quality or training methodology. The linear regression model provides a reasonable approximation of the relationship within the observed range of Model Sizes, but it's important to note that this relationship may not hold true indefinitely as models continue to grow.