## Scatter Plot: Model Size vs Average Reasoning and Capability Accuracy
### Overview
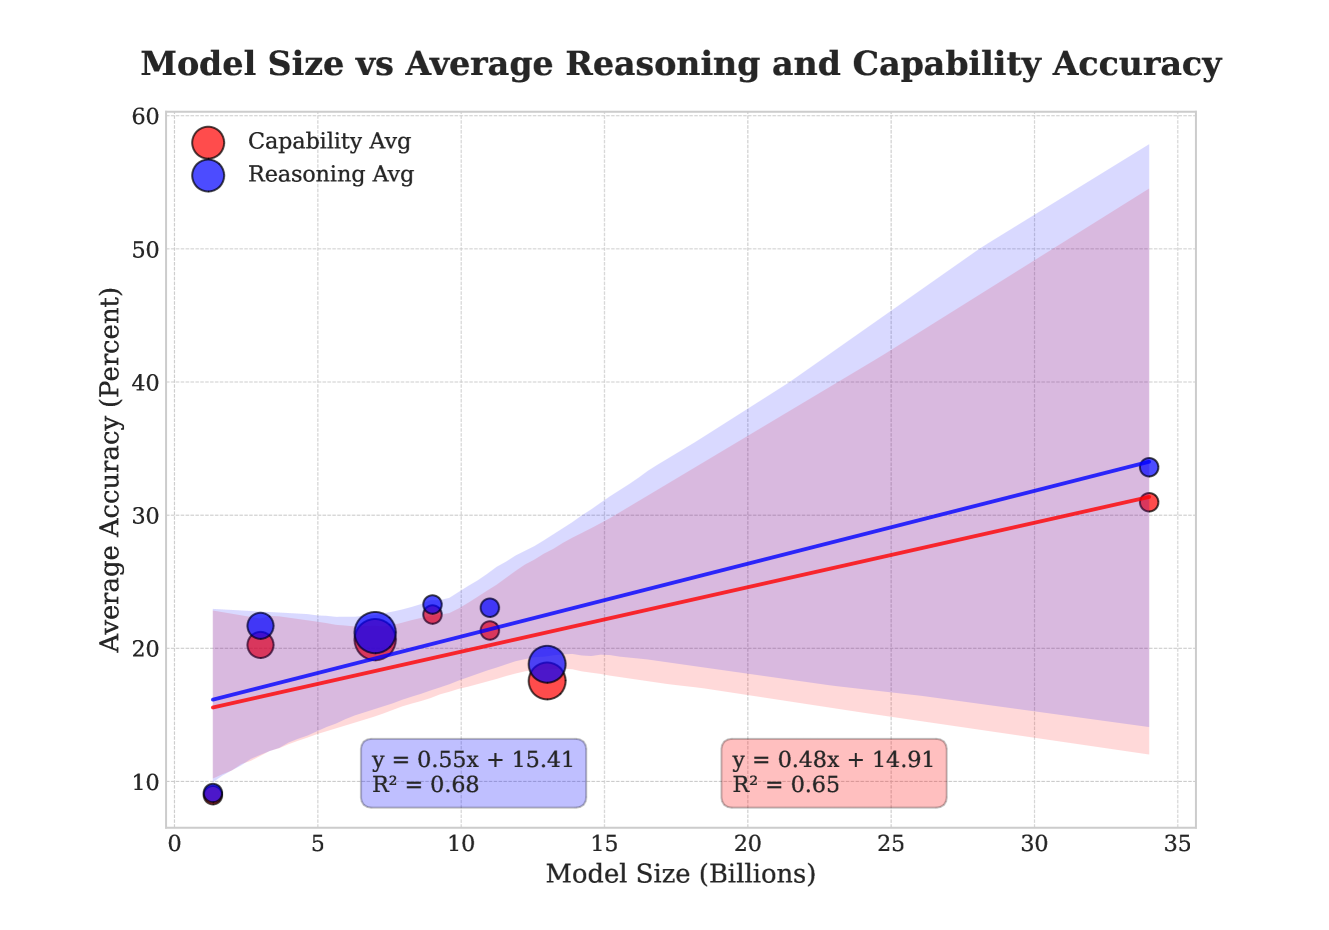
The image is a scatter plot comparing model size (in billions of parameters) to average accuracy in reasoning and capability tasks. Two data series are plotted: "Capability Avg" (red) and "Reasoning Avg" (blue), each with a trend line and shaded confidence interval. The plot includes axis labels, a legend, and numerical annotations for trend lines.
---
### Components/Axes
- **X-axis**: Model Size (Billions)
- Scale: 0 to 35 (increments of 5)
- Labels: "Model Size (Billions)"
- **Y-axis**: Average Accuracy (Percent)
- Scale: 0 to 60 (increments of 10)
- Labels: "Average Accuracy (Percent)"
- **Legend**:
- Red: "Capability Avg"
- Blue: "Reasoning Avg"
- **Trend Lines**:
- Red (Capability): `y = 0.48x + 14.91` (R² = 0.65)
- Blue (Reasoning): `y = 0.55x + 15.41` (R² = 0.68)
- **Shaded Regions**:
- Light blue (Reasoning): ±2% around the blue trend line
- Light red (Capability): ±2% around the red trend line
---
### Detailed Analysis
#### Data Points
- **Capability Avg (Red)**:
- (0, 9), (3, 20), (6, 21), (9, 22), (12, 18), (15, 17), (35, 31)
- **Reasoning Avg (Blue)**:
- (0, 9), (3, 22), (6, 22), (9, 23), (12, 22), (15, 19), (35, 33)
#### Trend Lines
- **Capability Avg**:
- Slope: 0.48 (moderate increase)
- Intercept: 14.91
- R²: 0.65 (65% variance explained)
- **Reasoning Avg**:
- Slope: 0.55 (steeper increase)
- Intercept: 15.41
- R²: 0.68 (68% variance explained)
#### Shaded Regions
- Both trend lines have ±2% confidence intervals, widening slightly at higher model sizes.
---
### Key Observations
1. **Positive Correlation**: Both capability and reasoning accuracy increase with model size.
2. **Steeper Growth for Reasoning**: The blue trend line (Reasoning) has a higher slope (0.55 vs. 0.48), indicating faster improvement.
3. **Variability**: Larger models (e.g., 35B) show wider shaded regions, suggesting greater uncertainty in accuracy measurements.
4. **R² Values**: Both trends explain ~65-68% of variance, implying model size is a strong but not sole predictor of accuracy.
---
### Interpretation
- **Model Size Impact**: Larger models improve performance in both reasoning and capability tasks, but reasoning accuracy grows more rapidly.
- **Confidence Intervals**: The shaded regions highlight that accuracy estimates for larger models are less precise, possibly due to increased complexity or measurement noise.
- **Practical Implications**: While model size is critical, other factors (e.g., architecture, training data) may also influence accuracy, as R² values are below 1.
- **Anomalies**: The red data point at (15B, 17%) deviates slightly from the trend, suggesting potential outliers or measurement errors.
This analysis underscores the trade-off between model size and performance gains, emphasizing the need for balanced optimization in AI development.