## Scatter Plot: Semantic Space of Hallucinations
### Overview
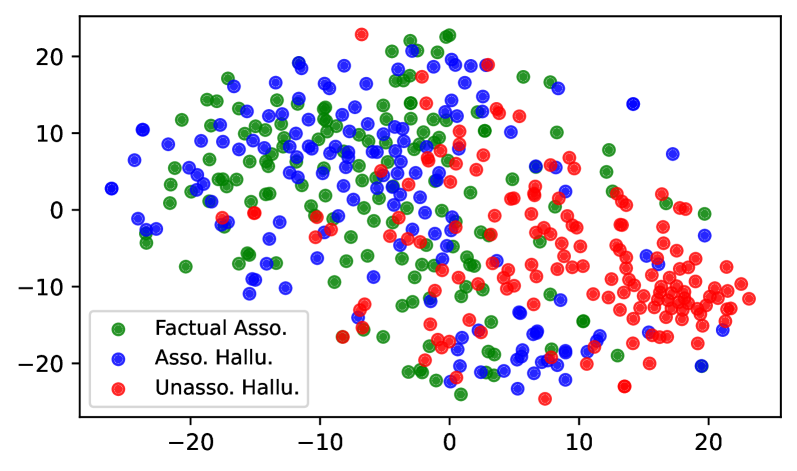
The image is a scatter plot visualizing the semantic space of different types of hallucinations. The plot displays three categories of data points: "Factual Asso." (green), "Asso. Hallu." (blue), and "Unasso. Hallu." (red). The x and y axes are unlabeled, but the data points are distributed across a range from approximately -25 to 25 on both axes.
### Components/Axes
* **X-axis:** Ranges from approximately -25 to 25, with tick marks at -20, -10, 0, 10, and 20.
* **Y-axis:** Ranges from approximately -25 to 25, with tick marks at -20, -10, 0, 10, and 20.
* **Legend (bottom-left):**
* Green: "Factual Asso."
* Blue: "Asso. Hallu."
* Red: "Unasso. Hallu."
### Detailed Analysis
* **Factual Asso. (Green):** The green data points are primarily concentrated in the upper-left quadrant of the plot, with a scattering of points throughout the rest of the space. The green points are mostly between x values of -25 to 5 and y values of -5 to 20.
* **Asso. Hallu. (Blue):** The blue data points are more evenly distributed across the plot, with a slight concentration in the upper-center region. The blue points are mostly between x values of -20 to 10 and y values of -10 to 20.
* **Unasso. Hallu. (Red):** The red data points are primarily concentrated in the bottom-right quadrant of the plot. The red points are mostly between x values of 0 to 20 and y values of -20 to 10.
### Key Observations
* The three categories of data points exhibit some degree of clustering, suggesting that they occupy distinct regions of the semantic space.
* The "Unasso. Hallu." category appears to be the most distinct, with a clear concentration in the bottom-right quadrant.
* The "Factual Asso." and "Asso. Hallu." categories have more overlap, particularly in the upper-left quadrant.
### Interpretation
The scatter plot suggests that different types of hallucinations can be distinguished based on their semantic properties. The clustering of data points indicates that "Factual Asso.", "Asso. Hallu.", and "Unasso. Hallu." occupy different regions of the semantic space. The "Unasso. Hallu." category, which is concentrated in the bottom-right quadrant, may represent hallucinations that are semantically distinct from the other two categories. The overlap between "Factual Asso." and "Asso. Hallu." suggests that these two categories may share some semantic similarities. The plot provides a visual representation of the semantic relationships between different types of hallucinations, which could be useful for understanding the underlying cognitive processes involved in their generation. The lack of axis labels limits the interpretation, but the relative positioning of the clusters is informative.