\n
## Scatter Plot: Distribution of Association and Hallucination Categories
### Overview
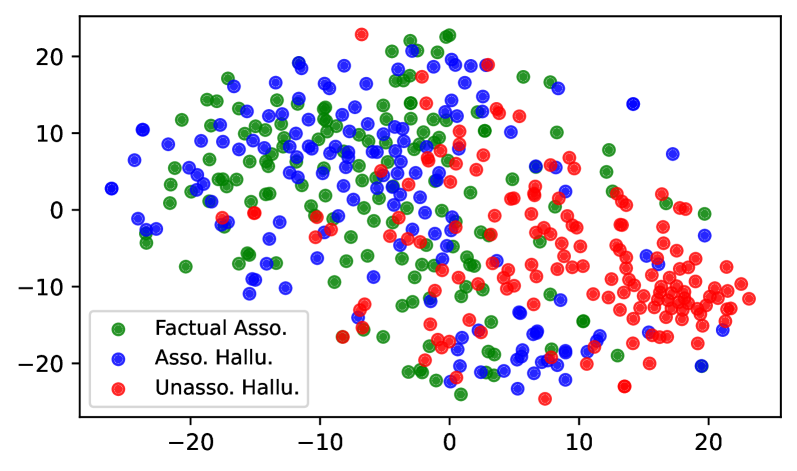
The image is a scatter plot displaying data points across a two-dimensional Cartesian coordinate system. The plot visualizes the distribution and clustering of three distinct categories of data, differentiated by color. The overall distribution shows significant overlap between categories in some regions and distinct clustering in others.
### Components/Axes
* **Chart Type:** Scatter Plot
* **X-Axis:** Linear scale ranging from approximately -25 to +25. Major tick marks are labeled at intervals of 10: -20, -10, 0, 10, 20.
* **Y-Axis:** Linear scale ranging from approximately -25 to +25. Major tick marks are labeled at intervals of 10: -20, -10, 0, 10, 20.
* **Legend:** Located in the bottom-left quadrant of the plot area. It contains three entries:
* **Green Circle:** Labeled "Factual Asso."
* **Blue Circle:** Labeled "Asso. Hallu."
* **Red Circle:** Labeled "Unasso. Hallu."
* **Data Points:** Hundreds of individual circular markers plotted according to their (x, y) coordinates.
### Detailed Analysis
**Spatial Distribution and Trends by Category:**
1. **Factual Asso. (Green):**
* **Trend/Cluster:** Primarily clustered in the upper-left quadrant (negative X, positive Y). The density is highest roughly between X = -20 to 0 and Y = 0 to 20.
* **Spread:** Shows a moderate spread, with some points extending into the upper-right quadrant and a few scattered in the lower half of the plot.
* **Visual Check:** The green points form a broad, diffuse cloud centered in the upper-left region.
2. **Asso. Hallu. (Blue):**
* **Trend/Cluster:** Heavily overlaps with the "Factual Asso." (green) cluster in the upper-left quadrant. The blue points are densely intermingled with the green points in the region of X = -20 to 0, Y = 0 to 20.
* **Spread:** Also shows a significant spread, with a notable tail of points extending diagonally down towards the bottom-right quadrant. Some blue points are found in all four quadrants.
* **Visual Check:** The blue points share the primary upper-left cluster with green but exhibit a more pronounced diagonal dispersion towards the lower-right.
3. **Unasso. Hallu. (Red):**
* **Trend/Cluster:** Forms a distinct, dense cluster primarily in the bottom-right quadrant (positive X, negative Y). The core of this cluster is centered approximately around X = 15, Y = -10.
* **Spread:** This category is the most spatially concentrated. While a few red points are scattered elsewhere (e.g., near the top center), the vast majority are tightly grouped in the lower-right region.
* **Visual Check:** The red cluster is visually separate from the main green/blue overlap, creating a clear separation in the plot's lower-right area.
**Cross-Reference Verification:**
* The legend's green circle corresponds to the points labeled "Factual Asso." located mainly in the upper-left.
* The legend's blue circle corresponds to the points labeled "Asso. Hallu." which overlap with green in the upper-left and spread diagonally.
* The legend's red circle corresponds to the points labeled "Unasso. Hallu." forming the distinct cluster in the bottom-right.
### Key Observations
1. **Primary Clustering:** There are two major clusters: a mixed green/blue cluster in the upper-left and a distinct red cluster in the bottom-right.
2. **Category Separation:** "Unasso. Hallu." (red) is largely separated from the other two categories, suggesting a fundamental difference in its underlying data characteristics.
3. **Category Overlap:** "Factual Asso." (green) and "Asso. Hallu." (blue) show substantial overlap, indicating these categories share similar characteristics in this 2D projection, though the blue series shows greater dispersion.
4. **Outliers:** A few red points appear near the top of the plot (Y ≈ 20), and a few blue points are found deep within the red cluster. These could be outliers or misclassifications.
### Interpretation
This scatter plot likely represents the output of a dimensionality reduction technique (like t-SNE or PCA) applied to high-dimensional data, projecting it into 2D for visualization. The data appears to be related to the analysis of associations and hallucinations, possibly in the context of language models or cognitive science.
* **What the data suggests:** The clear separation of "Unasso. Hallu." (Unassociated Hallucinations) implies that these instances have a distinct signature or feature set compared to associated hallucinations and factual associations. The significant overlap between "Factual Asso." and "Asso. Hallu." suggests that associated hallucinations may be generated through processes or possess features that are very similar to those involved in retrieving factual associations, making them harder to distinguish in this feature space.
* **Relationship between elements:** The spatial proximity in such plots typically indicates similarity. Therefore, the model or system being analyzed treats many "Asso. Hallu." cases similarly to "Factual Asso." cases, while "Unasso. Hallu." cases are treated as a separate class.
* **Notable implications:** The diagonal spread of the blue "Asso. Hallu." points from the main cluster towards the red cluster could represent a continuum or transition zone. This might indicate varying degrees of "association strength" or "hallucination confidence" within the associated hallucination category. The plot visually argues that unassociated hallucinations are a distinct phenomenon, while associated hallucinations are closely tied to factual retrieval processes.