## Scatter Plot: Distribution of Association Categories
### Overview
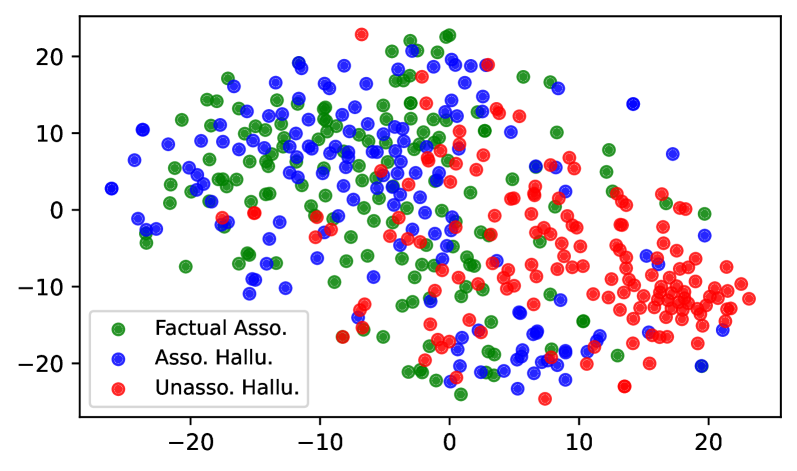
The image is a scatter plot displaying three distinct categories of data points: "Factual Asso." (green), "Asso. Hallu." (blue), and "Unasso. Hallu." (red). The plot spans a coordinate system with x and y axes ranging from -20 to 20. The legend is positioned in the bottom-left corner, clearly labeling each category with its corresponding color.
### Components/Axes
- **Axes**:
- X-axis: Labeled with numerical values from -20 to 20 (no explicit title).
- Y-axis: Labeled with numerical values from -20 to 20 (no explicit title).
- **Legend**:
- Located in the bottom-left corner.
- Labels:
- Green: "Factual Asso."
- Blue: "Asso. Hallu."
- Red: "Unasso. Hallu."
### Detailed Analysis
- **Factual Asso. (Green)**:
- Primarily located in the left and central regions of the plot.
- X-axis range: Approximately -20 to 10.
- Y-axis range: Approximately -10 to 20.
- Distribution: Scattered but with a slight concentration in the upper-left quadrant.
- **Asso. Hallu. (Blue)**:
- Concentrated in the central and right regions.
- X-axis range: Approximately -10 to 20.
- Y-axis range: Approximately -10 to 20.
- Distribution: Overlaps with green points in the central area but dominates the right side.
- **Unasso. Hallu. (Red)**:
- Dominates the right and lower-right regions.
- X-axis range: Approximately 0 to 20.
- Y-axis range: Approximately -10 to 10.
- Distribution: Highly clustered in the lower-right quadrant, with fewer points in the upper-right.
### Key Observations
1. **Color-Category Alignment**: All data points match the legend colors exactly (green = Factual Asso., blue = Asso. Hallu., red = Unasso. Hallu.).
2. **Spatial Clustering**:
- Red points (Unasso. Hallu.) are the most concentrated, forming a dense cluster in the lower-right quadrant.
- Blue points (Asso. Hallu.) show a broader spread but are more prevalent in the right half of the plot.
- Green points (Factual Asso.) are more dispersed, with a notable presence in the left and central areas.
3. **Overlap**: Blue and green points overlap significantly in the central region, suggesting potential ambiguity or similarity between these categories.
### Interpretation
The plot suggests a spatial distribution of three categories with distinct clustering patterns. The red points (Unasso. Hallu.) are tightly grouped in the lower-right, indicating a possible correlation with higher x-values and lower y-values. The blue and green points, while overlapping in the center, show different spatial tendencies: blue points extend further right, while green points are more spread out in the left. This could imply that "Unasso. Hallu." is a more homogeneous or constrained category compared to the others. The lack of axis titles limits direct interpretation of the axes' meanings, but the relative positions of the points suggest a possible relationship between the categories and their coordinates.