# Technical Document Extraction: Line Graph Analysis
## Image Overview
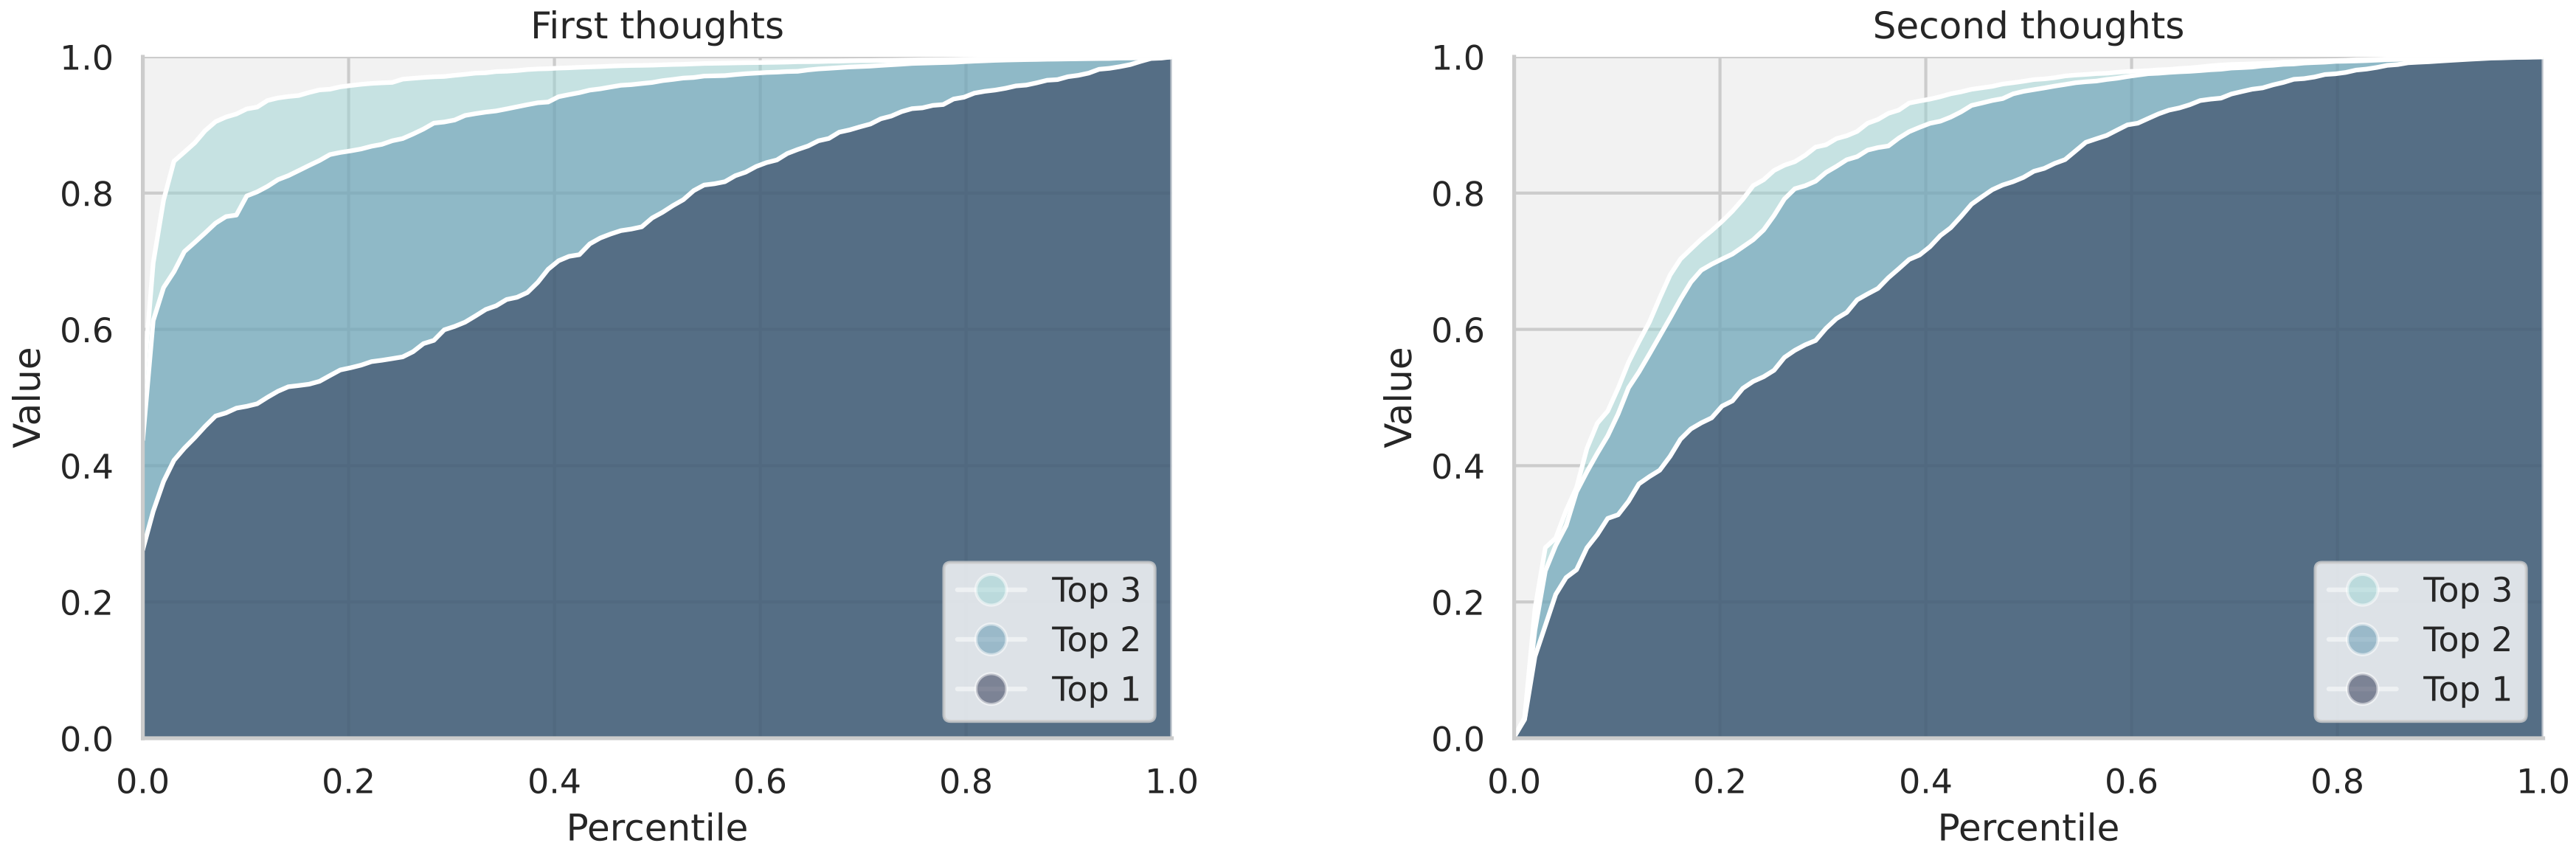
The image contains **two side-by-side line graphs** titled "First thoughts" (left) and "Second thoughts" (right). Both graphs share identical axes and legend structures but differ in line curvature and data point distribution.
---
### **1. Axis Labels and Markers**
- **X-axis**:
- Title: `Percentile`
- Range: `0.0` to `1.0` (increments of `0.2`)
- Markers: Gridlines at every `0.2` interval
- **Y-axis**:
- Title: `Value`
- Range: `0.0` to `1.0` (increments of `0.2`)
- Markers: Gridlines at every `0.2` interval
---
### **2. Legend**
- **Placement**: Bottom-left corner of each graph
- **Labels and Colors**:
- `Top 1`: Darkest blue (`#003f5c`)
- `Top 2`: Medium blue (`#2f4b7c`)
- `Top 3`: Lightest blue (`#665191`)
- **Note**: Colors match the corresponding lines in both graphs.
---
### **3. Line Graph Components**
#### **Left Graph: "First thoughts"**
- **Lines**:
- `Top 1`: Steepest upward curve, reaching ~0.95 at `Percentile = 1.0`
- `Top 2`: Moderate upward curve, reaching ~0.85 at `Percentile = 1.0`
- `Top 3`: Gentle upward curve, reaching ~0.75 at `Percentile = 1.0`
- **Trend**: All lines originate at `(0, 0)` and ascend monotonically. `Top 1` dominates the upper region, while `Top 3` remains closest to the baseline.
#### **Right Graph: "Second thoughts"**
- **Lines**:
- `Top 1`: Slightly less steep than left graph, reaching ~0.90 at `Percentile = 1.0`
- `Top 2`: Similar to left graph, reaching ~0.80 at `Percentile = 1.0`
- `Top 3`: Flatter curve, reaching ~0.65 at `Percentile = 1.0`
- **Trend**: Lines exhibit reduced separation compared to the left graph. `Top 1` and `Top 2` converge more closely near `Percentile = 1.0`.
---
### **4. Key Observations**
- **Consistency**: Both graphs share identical axis ranges and legend structure.
- **Divergence**:
- "Second thoughts" lines are generally lower in value than "First thoughts" at equivalent percentiles.
- `Top 3` shows the most significant reduction in value between the two graphs.
- **No Embedded Text**: No additional annotations or data tables are present.
---
### **5. Spatial Grounding**
- **Legend Position**: `[x=0.05, y=0.05]` relative to each graph’s bottom-left corner.
- **Line Placement**:
- `Top 1` consistently occupies the uppermost region.
- `Top 3` remains closest to the baseline across all percentiles.
---
### **6. Trend Verification**
- **Left Graph ("First thoughts")**:
- `Top 1`: Steep upward slope (highest value gain).
- `Top 2`: Moderate upward slope.
- `Top 3`: Gentle upward slope.
- **Right Graph ("Second thoughts")**:
- All lines exhibit reduced steepness compared to the left graph.
- `Top 1` and `Top 2` converge near `Percentile = 1.0`.
---
### **7. Component Isolation**
- **Header**: Titles "First thoughts" and "Second thoughts" in bold black text.
- **Main Chart**: Dual-axis line graphs with gridlines and shaded regions.
- **Footer**: Legend box with color-coded labels.
---
### **8. Data Extraction**
No explicit numerical data points are labeled. Values are inferred from line positions relative to gridlines:
- **Example (Left Graph)**:
- At `Percentile = 0.5`:
- `Top 1`: ~0.7
- `Top 2`: ~0.6
- `Top 3`: ~0.5
---
### **9. Language and Translation**
- **Primary Language**: English
- **No Additional Languages Detected**
---
### **10. Final Notes**
- The graphs likely represent cumulative distribution functions or percentile-based value rankings.
- The shaded regions between lines suggest confidence intervals or value ranges, though this is not explicitly labeled.