## Spectrogram Grid: Audio Signal Processing Comparison
### Overview
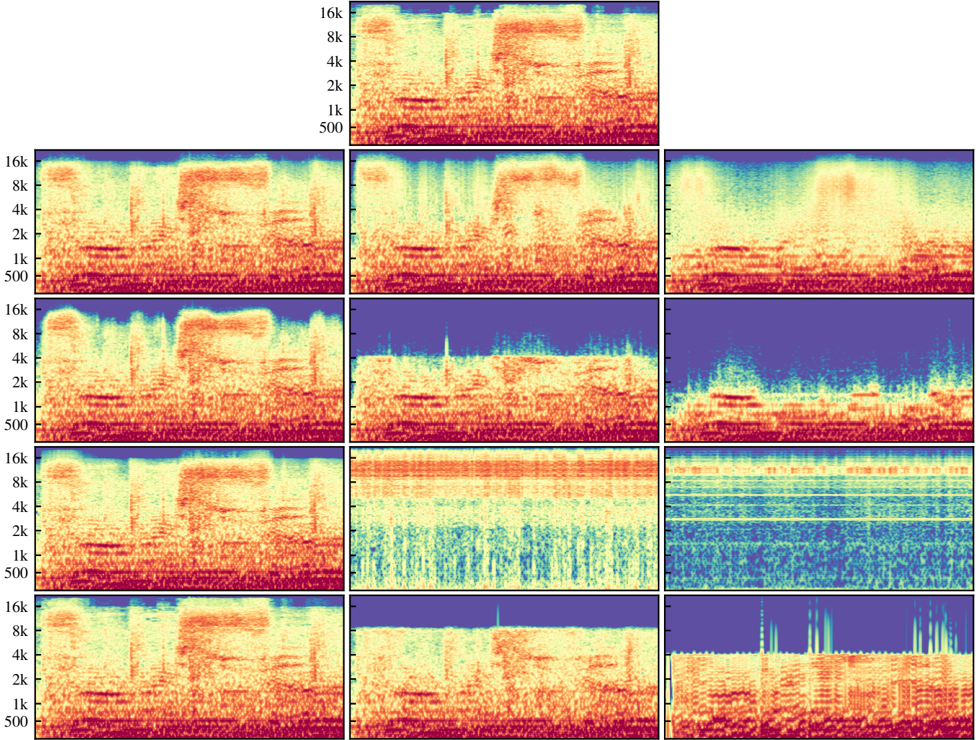
This image displays a grid of 13 spectrograms, likely representing a comparison of audio signal processing techniques, generative model outputs, or noise reduction algorithms. The top row contains a single spectrogram, while the subsequent four rows each contain three spectrograms. The leftmost column (Rows 2–5) appears to be a consistent reference signal (Ground Truth), while the middle and right columns display various processed versions of that signal, exhibiting different spectral characteristics, filtering effects, and artifacts.
### Components/Axes
* **Y-Axis (Frequency):** Logarithmic scale, labeled with the following markers (from bottom to top): 500, 1k, 2k, 4k, 8k, 16k.
* **X-Axis (Time):** Unlabeled, representing the temporal progression of the audio signal.
* **Color Mapping:** The heat map uses a standard spectrogram color scale:
* **Dark Blue/Purple:** Low energy/silence.
* **Red/Orange:** Moderate energy.
* **Yellow/White:** High energy/peaks.
### Detailed Analysis
The grid is organized into a 5-row structure. We will define the positions as (Row, Column).
**Row 1:**
* **(1, 1):** The reference spectrogram. It shows a full-spectrum signal with significant energy across the 500Hz to 16kHz range.
**Row 2:**
* **(2, 1):** Matches the reference signal in (1, 1).
* **(2, 2):** Similar to the reference, but with slightly reduced high-frequency energy above 12kHz.
* **(2, 3):** Exhibits a clear low-pass filter effect; energy is significantly attenuated above 8kHz.
**Row 3:**
* **(3, 1):** Matches the reference signal.
* **(3, 2):** Shows a sharp spectral cutoff at approximately 4kHz.
* **(3, 3):** Significant signal degradation. The signal is mostly confined below 2kHz, with high-frequency noise or "hiss" artifacts visible above 2kHz.
**Row 4:**
* **(4, 1):** Matches the reference signal.
* **(4, 2):** Displays distinct horizontal spectral lines (harmonic artifacts) across the entire frequency range, suggesting a reconstruction or quantization error.
* **(4, 3):** Very sparse spectral content. It shows horizontal lines (tones) and a lack of the complex, broadband structure seen in the reference.
**Row 5:**
* **(5, 1):** Matches the reference signal.
* **(5, 2):** Shows a sharp cutoff at approximately 8kHz, with some vertical transient artifacts.
* **(5, 3):** Shows a sharp cutoff at approximately 4kHz, with distinct vertical "chirp" or transient artifacts extending into the higher frequencies.
### Key Observations
* **Reference Consistency:** The leftmost column (Rows 2–5) is identical to the top row, serving as the control or "Ground Truth" signal.
* **Spectral Filtering:** Several plots (e.g., 3,2; 5,3) demonstrate aggressive low-pass filtering, effectively removing information above 4kHz.
* **Artifact Generation:** Plots (4,2) and (4,3) show evidence of harmonic distortion or "spectral lines," which are common artifacts in lossy compression or generative audio models.
* **Energy Distribution:** The reference signal is broadband, whereas the processed signals show varying degrees of "spectral holes" (missing frequency bands) and noise floor elevation.
### Interpretation
This image is characteristic of a figure from a technical paper evaluating audio synthesis or enhancement models (e.g., GANs, Diffusion models, or Vocoders).
* **What the data demonstrates:** The grid illustrates how different models or processing parameters affect the frequency content of an audio signal. The leftmost column provides the target, while the other columns show the "reconstruction" quality of various methods.
* **Why it matters:** In audio engineering and machine learning, preserving the full frequency spectrum (up to 16kHz+) is critical for high-fidelity audio. The variations in the middle and right columns highlight specific failure modes:
* **Low-pass filtering:** Loss of "air" or high-frequency detail.
* **Spectral lines:** Audible metallic or robotic artifacts.
* **Noise floor elevation:** Audible hiss or background interference.
* **Peircean Investigative Note:** The progression from the top-left reference to the increasingly degraded signals in the bottom-right suggests a comparative study where the models are ranked or categorized by their ability to reconstruct the original signal without introducing the artifacts observed in the rightmost column.