## Heatmap: NTM vs LSTM Performance
### Overview
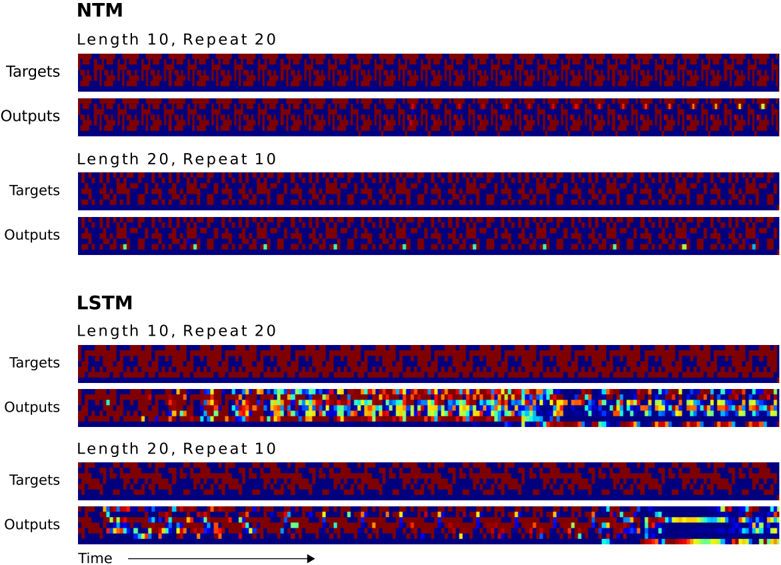
The image presents a comparison of the performance of two neural network models, NTM (Neural Turing Machine) and LSTM (Long Short-Term Memory), on a sequence learning task. The performance is visualized as heatmaps, where each row represents either the target sequence or the model's output sequence. Two different sequence configurations are tested: "Length 10, Repeat 20" and "Length 20, Repeat 10". The heatmaps use color to indicate the activation level or the presence of a specific element in the sequence.
### Components/Axes
* **Models:** NTM (top) and LSTM (bottom)
* **Sequence Configurations:**
* Length 10, Repeat 20
* Length 20, Repeat 10
* **Rows:**
* Targets: The desired output sequence.
* Outputs: The sequence generated by the model.
* **X-axis:** Represents "Time" (indicated by an arrow pointing right).
* **Color Scale:** The heatmap uses a color scale, where blue likely represents a low activation or absence of an element, and colors progressing towards red, yellow, and potentially white represent increasing activation levels or presence.
### Detailed Analysis
**NTM:**
* **Length 10, Repeat 20:**
* **Targets:** The target sequence shows a repeating pattern of length 10. The pattern consists of alternating blocks of red and blue.
* **Outputs:** The output sequence closely matches the target sequence, with a similar repeating pattern of red and blue blocks. There are some minor deviations, indicated by slightly different color intensities.
* **Length 20, Repeat 10:**
* **Targets:** The target sequence shows a repeating pattern of length 20, with alternating blocks of red and blue.
* **Outputs:** The output sequence mostly matches the target sequence, but there are some errors. There are a few isolated pixels of a different color (likely green or yellow) scattered throughout the output.
**LSTM:**
* **Length 10, Repeat 20:**
* **Targets:** The target sequence shows a repeating pattern of length 10, with alternating blocks of red and blue.
* **Outputs:** The output sequence is significantly different from the target sequence. It shows a more complex pattern with a wider range of colors, including blue, cyan, yellow, and red. The repeating pattern is not as clear as in the target sequence.
* **Length 20, Repeat 10:**
* **Targets:** The target sequence shows a repeating pattern of length 20, with alternating blocks of red and blue.
* **Outputs:** The output sequence shows some resemblance to the target sequence, but it also contains significant errors. The repeating pattern is less clear, and there are regions with different colors, including blue, cyan, yellow, and red. Towards the end of the sequence, the output seems to align better with the target.
### Key Observations
* NTM performs better than LSTM on this sequence learning task, especially for the "Length 10, Repeat 20" configuration.
* LSTM struggles to accurately reproduce the target sequences, particularly for the "Length 10, Repeat 20" configuration.
* Both models show some errors in the "Length 20, Repeat 10" configuration, but NTM's errors are less pronounced.
* The color variations in the LSTM outputs suggest that the model is not confident in its predictions and is exploring a wider range of possibilities.
### Interpretation
The heatmaps provide a visual representation of the performance of NTM and LSTM on a sequence learning task. The results suggest that NTM is better suited for learning simple repeating patterns than LSTM. LSTM's struggle to accurately reproduce the target sequences may be due to its more complex architecture, which can lead to overfitting or difficulty in learning simple patterns. The errors in both models' outputs for the "Length 20, Repeat 10" configuration suggest that longer sequences are more challenging to learn. The color variations in the LSTM outputs indicate that the model is less confident in its predictions and is exploring a wider range of possibilities. This could be due to the model's internal state being less stable or its inability to capture the underlying structure of the sequence.