## Heatmaps: NTM and LSTM Performance Comparison
### Overview
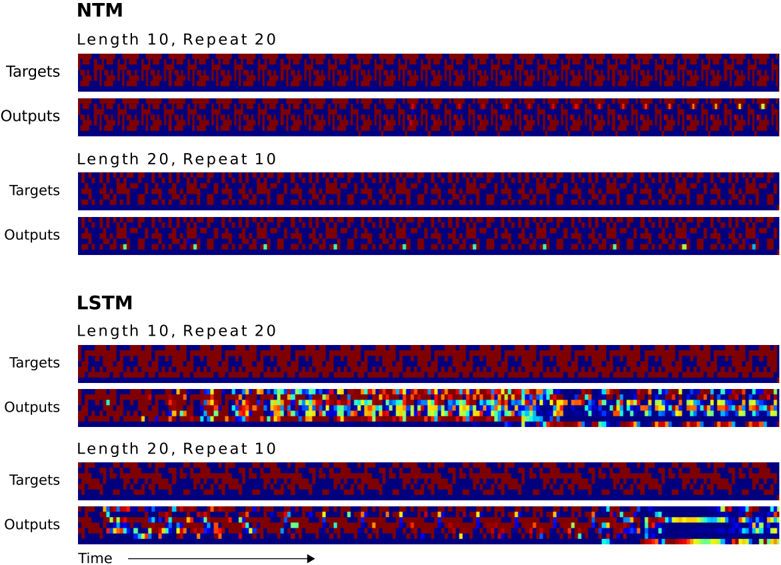
The image presents four heatmaps visualizing the performance of two neural network models, NTM (Neural Turing Machine) and LSTM (Long Short-Term Memory), under different conditions. Each heatmap represents a model's "Targets" (desired outputs) versus its "Outputs" (actual predictions) for a specific combination of sequence length and repetition count. The heatmaps use a color gradient to represent the intensity of activation or similarity, with darker colors (approaching black) indicating lower values and brighter colors (red/yellow) indicating higher values.
### Components/Axes
The image is divided into two main sections, one for NTM and one for LSTM. Each section contains two heatmaps, defined by:
* **Model:** NTM or LSTM
* **Length:** 10 or 20 (representing the sequence length)
* **Repeat:** 20 or 10 (representing the number of repetitions)
* **Rows:** "Targets" and "Outputs"
* **Horizontal Axis:** Represents "Time" as indicated by the arrow at the bottom-right. The axis is not numerically labeled, but represents progression through the sequence.
* **Color Scale:** A gradient from dark blue (low activation) to red/yellow (high activation).
### Detailed Analysis or Content Details
**NTM - Length 10, Repeat 20:**
* **Targets:** The heatmap shows a relatively uniform distribution of dark blue and red pixels, indicating a consistent but not highly concentrated activation pattern. There are some areas of brighter red, but they are interspersed with darker blue.
* **Outputs:** Similar to "Targets", the "Outputs" heatmap displays a mix of dark blue and red pixels. There appears to be a slightly more structured pattern, with some vertical bands of red.
**NTM - Length 20, Repeat 10:**
* **Targets:** The "Targets" heatmap exhibits a more pronounced pattern of alternating dark blue and red bands. The red bands are more frequent and wider than in the previous heatmap.
* **Outputs:** The "Outputs" heatmap shows a similar pattern to "Targets", with alternating bands of dark blue and red. The red bands appear to be slightly less frequent and less defined than in the "Targets" heatmap.
**LSTM - Length 10, Repeat 20:**
* **Targets:** The "Targets" heatmap displays a very distinct and regular pattern of alternating dark blue and bright red pixels. This creates a clear, striped appearance.
* **Outputs:** The "Outputs" heatmap shows a more complex pattern. While there are still alternating bands, they are less regular and more fragmented than in the "Targets" heatmap. There are also areas of yellow and green, indicating intermediate activation levels.
**LSTM - Length 20, Repeat 10:**
* **Targets:** The "Targets" heatmap shows a similar pattern to the LSTM - Length 10, Repeat 20, with alternating dark blue and bright red bands.
* **Outputs:** The "Outputs" heatmap displays a highly dynamic pattern. The color distribution is more varied, with a gradient from blue to green to yellow, and finally to red. There is a clear progression of color from left to right, with the rightmost side being predominantly red.
### Key Observations
* **NTM:** The NTM heatmaps show a more diffuse activation pattern compared to the LSTM heatmaps. The patterns are less structured and less consistent.
* **LSTM:** The LSTM heatmaps exhibit a more distinct and regular activation pattern, particularly in the "Targets" heatmaps. The "Outputs" heatmaps show a more complex and dynamic pattern, with a clear progression of activation over time.
* **Length & Repeat:** Increasing the sequence length (from 10 to 20) appears to result in more pronounced patterns in both models. Decreasing the repetition count (from 20 to 10) seems to affect the complexity of the output patterns.
* **Targets vs. Outputs:** In general, the "Outputs" heatmaps are more complex and less structured than the "Targets" heatmaps, indicating that the models are not perfectly replicating the desired outputs.
### Interpretation
The heatmaps suggest that the LSTM model is better at learning and reproducing the target patterns compared to the NTM model, especially for the shorter sequence length (10). The clear, striped patterns in the LSTM "Targets" heatmaps indicate a strong ability to capture the underlying structure of the data. The more complex patterns in the LSTM "Outputs" heatmaps suggest that the model is actively processing the information and generating dynamic responses.
The NTM model, on the other hand, exhibits a more diffuse activation pattern, indicating that it may be struggling to capture the underlying structure of the data. The less structured patterns in the NTM "Outputs" heatmaps suggest that the model is generating less coherent and less predictable responses.
The changes in patterns with different sequence lengths and repetition counts suggest that the models' performance is sensitive to these parameters. The progression of color in the LSTM - Length 20, Repeat 10 "Outputs" heatmap may indicate that the model is learning to adapt its responses over time.
The image provides a visual comparison of the internal representations learned by the two models, offering insights into their strengths and weaknesses. The data suggests that LSTM is more effective at this task, but both models exhibit complex behavior that warrants further investigation.