## Object Detection Overlay: Aerial Road Intersection
### Overview
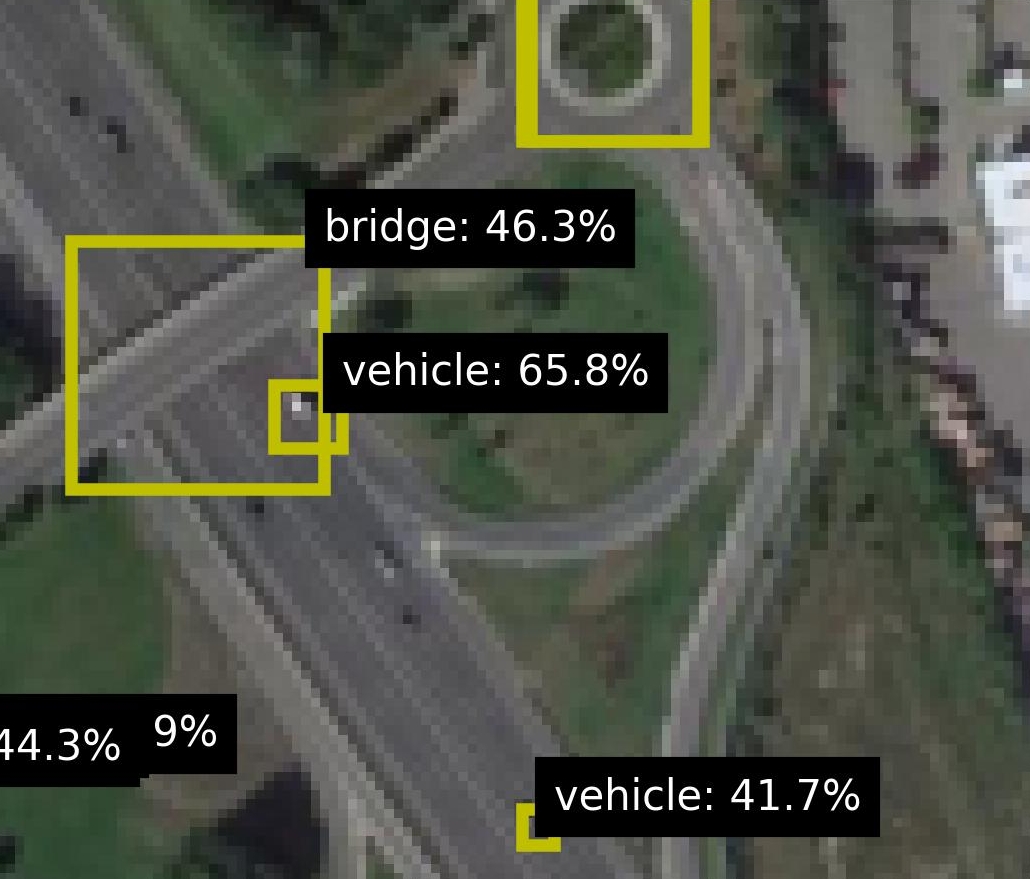
The image is a low-resolution aerial or satellite photograph of a road intersection, likely a roundabout or complex junction, overlaid with the output of an object detection algorithm. The algorithm has placed yellow bounding boxes around specific features and assigned them class labels with associated confidence percentages. The scene includes paved roads, grassy areas, and some indistinct structures.
### Components/Axes
* **Image Type:** Aerial/Satellite photograph with object detection overlay.
* **Primary Visual Elements:**
* **Road Network:** A multi-lane road runs diagonally from the top-left to the bottom-right. A curved road or ramp connects to it, forming a partial loop or roundabout in the upper-right quadrant.
* **Green Spaces:** Areas of grass or low vegetation are visible between the road segments.
* **Detection Overlays:** Four distinct yellow bounding boxes with black text labels are present.
* **Text Labels (Transcribed Exactly):**
1. `bridge: 46.3%` (Position: Upper-left quadrant, over a road segment)
2. `vehicle: 65.8%` (Position: Center-left, over a small object on the road)
3. `vehicle: 41.7%` (Position: Bottom-center, over a small object on the lower road)
4. `44.3% 9%` (Position: Bottom-left corner, partially cut off. The label format is atypical, showing two percentages without a clear class label.)
### Detailed Analysis
* **Detection 1 (bridge: 46.3%):**
* **Spatial Grounding:** A large yellow bounding box is positioned in the upper-left quadrant. It encloses a section of the main road where it appears to pass over another feature (possibly another road or a depression), consistent with a bridge or overpass structure.
* **Trend/Confidence:** The model expresses low-to-moderate confidence (46.3%) in this classification. The visual evidence for a bridge is ambiguous at this resolution.
* **Detection 2 (vehicle: 65.8%):**
* **Spatial Grounding:** A smaller yellow bounding box is located near the center-left of the image, directly on the main road surface. It surrounds a small, dark, rectangular object.
* **Trend/Confidence:** The model has moderate confidence (65.8%) that this object is a vehicle. The object's size and position on the roadway support this classification.
* **Detection 3 (vehicle: 41.7%):**
* **Spatial Grounding:** A small yellow bounding box is placed at the bottom-center of the image, on the lower section of the main road. It also surrounds a small, dark object.
* **Trend/Confidence:** The model has lower confidence (41.7%) in this vehicle detection compared to the other. The object may be smaller, less distinct, or partially obscured.
* **Detection 4 (44.3% 9%):**
* **Spatial Grounding:** This label is in the bottom-left corner and is partially cropped. No clear bounding box is associated with it in the visible frame.
* **Content:** The text `44.3% 9%` is anomalous. It may represent two separate confidence scores (e.g., for two closely spaced objects) or a formatting error in the overlay. No class label is visible.
* **Unlabeled Feature:**
* **Spatial Grounding:** A yellow bounding box is present at the top-center of the image, around a circular paved area (likely a roundabout center or a traffic circle).
* **Observation:** This box has no associated text label in the visible image, suggesting the detection may have been filtered out, or the label is outside the frame.
### Key Observations
1. **Variable Confidence:** The model's confidence varies significantly, from 41.7% to 65.8% for the "vehicle" class, and 46.3% for "bridge." This suggests challenges with the image resolution or the clarity of the objects.
2. **Incomplete Data:** One detection label is partially cut off, and one bounding box (around the circular feature) lacks a visible label, making the full detection set unclear.
3. **Object Scale:** The detected "vehicle" objects are very small relative to the image, comprising only a few pixels, which explains the moderate confidence scores.
4. **Scene Context:** The infrastructure (multi-lane roads, ramps) is consistent with an area where bridges and vehicles would be expected, providing contextual support for the model's classifications despite low confidence.
### Interpretation
This image demonstrates the output of a computer vision model performing object detection on aerial imagery. The primary purpose is likely automated feature extraction for mapping, traffic monitoring, or infrastructure assessment.
* **What the Data Suggests:** The model is attempting to identify and localize key transportation assets (vehicles, bridges) from a top-down view. The varying confidence scores highlight the difficulty of this task with low-resolution input; the model is "uncertain" about its identifications.
* **Relationship Between Elements:** The bounding boxes and labels are directly linked, with the text providing the model's interpretation of the visual data within each box. The spatial placement confirms the model is analyzing specific, localized regions of the larger scene.
* **Notable Anomalies:**
* The `44.3% 9%` label is a significant anomaly. It breaks the standard `[class]: [confidence]%` format, indicating a potential bug in the visualization code or an edge case in the detection pipeline (e.g., overlapping detections).
* The absence of a label for the circular feature's bounding box is also notable. It could mean the detection was below a confidence threshold for display, or the class name was not rendered.
* **Underlying Implications:** The image serves as a diagnostic view into an AI perception system. It reveals not just *what* the system sees, but *how sure* it is. For a technical user, this is more valuable than a perfect detection, as it exposes the system's limitations and areas for improvement (e.g., needing higher-resolution imagery or a model fine-tuned for small-object detection from aerial views). The scene itself is mundane, but the overlay transforms it into a report on algorithmic performance.