## Satellite Image with Annotated Landmarks and Vehicle Detection
### Overview
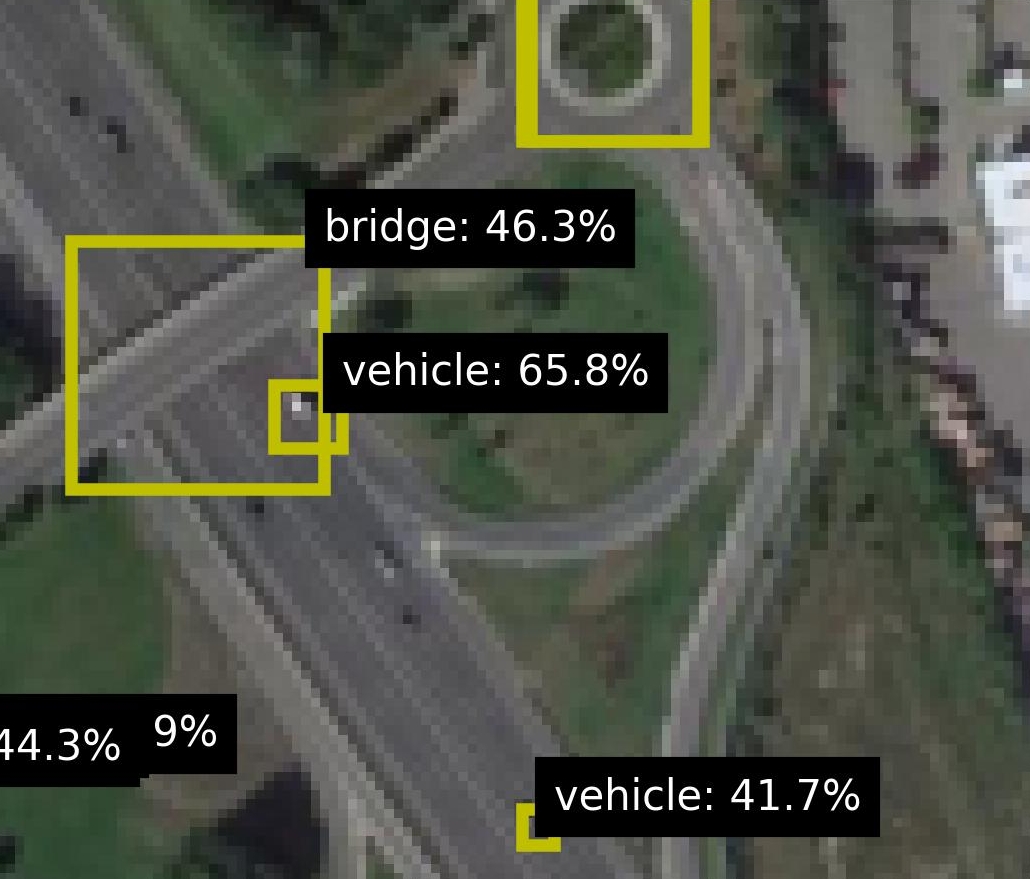
The image depicts a satellite view of a highway interchange with annotated landmarks and vehicle detection results. Key elements include:
- A curved highway interchange with multiple lanes
- Two yellow bounding boxes highlighting specific areas
- Text annotations with percentages indicating detection confidence scores
- A circular roadway feature in the upper-right quadrant
### Components/Axes
**Annotations:**
1. **Bridge**: Labeled "bridge: 46.3%" in a black box with white text, positioned above a yellow bounding box covering a bridge structure.
2. **Vehicle 1**: Labeled "vehicle: 65.8%" in a black box, located near the bridge annotation.
3. **Vehicle 2**: Labeled "vehicle: 41.7%" in a black box, positioned in the bottom-right quadrant.
4. **Unlabeled Percentages**: "44.3%" and "9%" in black boxes at the bottom-left, with no direct visual reference.
**Visual Elements:**
- **Highway**: Gray asphalt roads with white lane markings
- **Vegetation**: Green areas indicating grass/trees
- **Buildings**: Light-colored structures in the upper-right
- **Bounding Boxes**: Yellow rectangles highlighting the bridge and two vehicles
### Detailed Analysis
**Bridge Annotation (46.3%)**
- Positioned at the top-left intersection of the interchange
- Yellow bounding box covers a concrete bridge structure
- Confidence score suggests moderate detection certainty
**Vehicle 1 (65.8%)**
- Located near the bridge, slightly downstream on the highway
- Small yellow box highlights a single vehicle
- Highest confidence score among annotations
**Vehicle 2 (41.7%)**
- Positioned in the bottom-right quadrant
- Yellow box covers a vehicle near the interchange exit
- Lower confidence than Vehicle 1 but higher than the bridge
**Unlabeled Percentages (44.3% and 9%)**
- Located in the bottom-left quadrant
- No direct visual correlation to specific objects
- May represent background detection scores or partial annotations
### Key Observations
1. **Confidence Score Variance**: Vehicle detections show higher confidence (65.8% and 41.7%) compared to the bridge (46.3%).
2. **Spatial Distribution**: High-confidence detections cluster near the bridge, suggesting possible model bias toward infrastructure features.
3. **Ambiguous Annotations**: The 9% value lacks a clear visual reference, potentially indicating a false positive or partial detection.
4. **Bridge Detection Challenge**: The bridge's 46.3% score may reflect difficulties in detecting large, static structures compared to moving vehicles.
### Interpretation
This image demonstrates a computer vision system's performance in detecting highway infrastructure and vehicles. The higher confidence scores for vehicles (65.8% and 41.7%) suggest the model performs better at identifying dynamic objects than static structures like bridges. The bridge's 46.3% score might indicate challenges in distinguishing complex infrastructure features from surrounding terrain. The 9% unlabeled percentage could represent either a low-confidence detection or an annotation error. The spatial clustering of high-confidence detections near the bridge may reflect training data biases or model focus on specific features. These results highlight the importance of context-aware object detection in transportation monitoring systems, where both infrastructure and vehicle tracking are critical for safety and traffic management.