## Line Chart: LINK Token Spent
### Overview
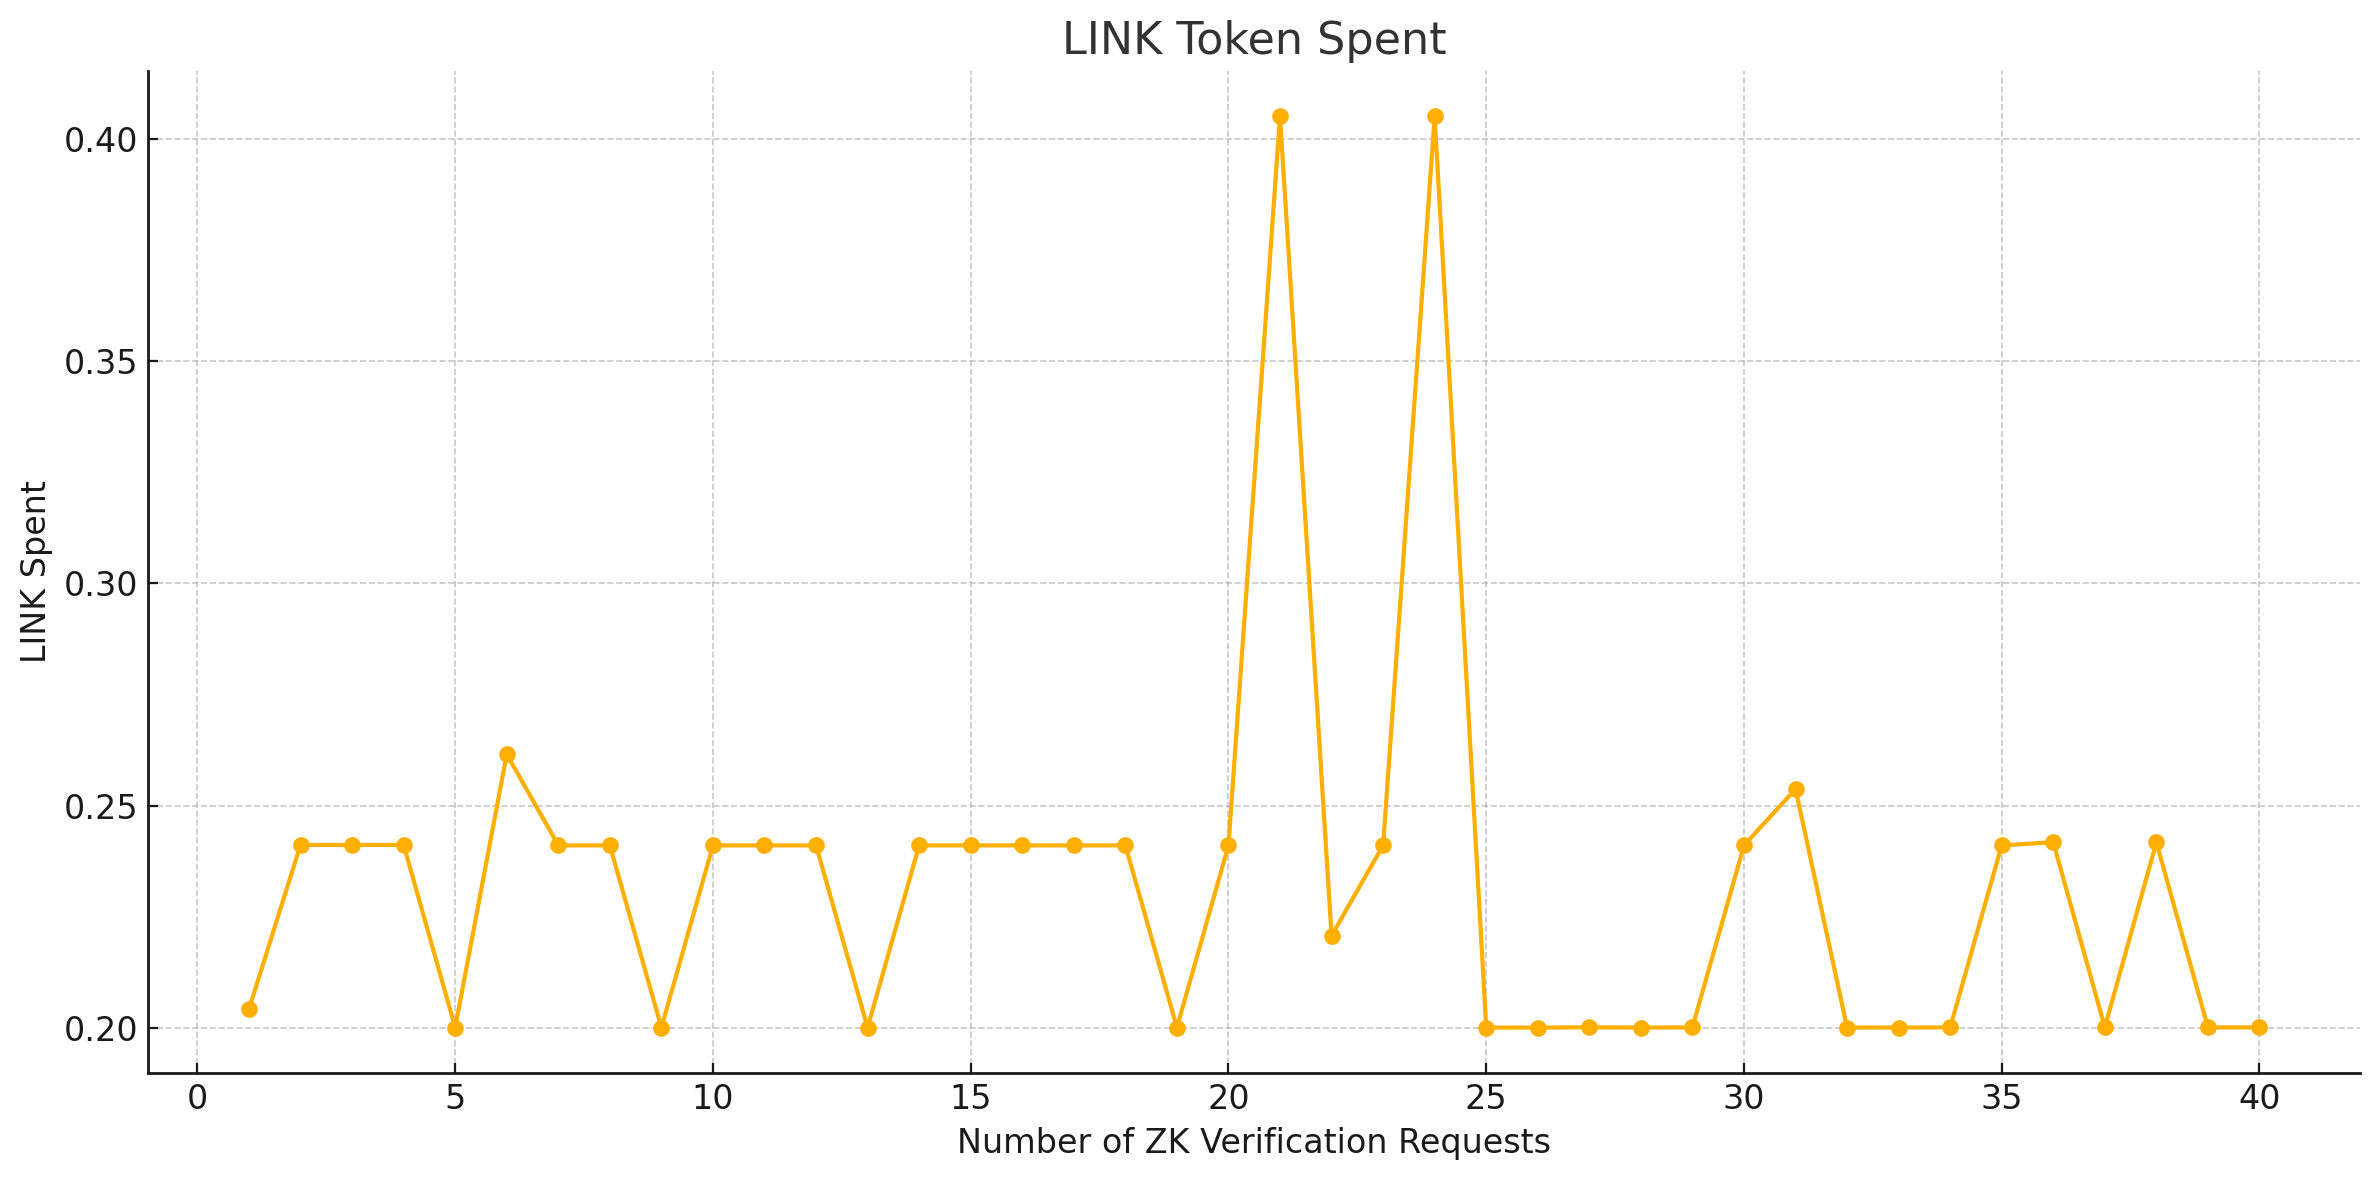
The image is a line chart that depicts the relationship between the number of ZK Verification Requests (x-axis) and the amount of LINK tokens spent (y-axis). The chart shows fluctuations in LINK token spending as the number of verification requests changes.
### Components/Axes
* **Title:** LINK Token Spent
* **X-axis:** Number of ZK Verification Requests, ranging from 0 to 40 in increments of 5.
* **Y-axis:** LINK Spent, ranging from 0.20 to 0.40 in increments of 0.05.
* **Data Series:** A single line in gold color represents the LINK token spent for each number of ZK Verification Requests.
### Detailed Analysis
The gold line represents the LINK token spent.
* **ZK Verification Requests = 0:** LINK Spent ≈ 0.20
* **ZK Verification Requests = 2:** LINK Spent ≈ 0.24
* **ZK Verification Requests = 5:** LINK Spent ≈ 0.24
* **ZK Verification Requests = 6:** LINK Spent ≈ 0.26
* **ZK Verification Requests = 8:** LINK Spent ≈ 0.20
* **ZK Verification Requests = 9:** LINK Spent ≈ 0.24
* **ZK Verification Requests = 11:** LINK Spent ≈ 0.24
* **ZK Verification Requests = 12:** LINK Spent ≈ 0.20
* **ZK Verification Requests = 14:** LINK Spent ≈ 0.24
* **ZK Verification Requests = 15:** LINK Spent ≈ 0.24
* **ZK Verification Requests = 17:** LINK Spent ≈ 0.24
* **ZK Verification Requests = 20:** LINK Spent ≈ 0.22
* **ZK Verification Requests = 22:** LINK Spent ≈ 0.41
* **ZK Verification Requests = 24:** LINK Spent ≈ 0.24
* **ZK Verification Requests = 25:** LINK Spent ≈ 0.41
* **ZK Verification Requests = 26:** LINK Spent ≈ 0.20
* **ZK Verification Requests = 28:** LINK Spent ≈ 0.20
* **ZK Verification Requests = 30:** LINK Spent ≈ 0.20
* **ZK Verification Requests = 31:** LINK Spent ≈ 0.25
* **ZK Verification Requests = 33:** LINK Spent ≈ 0.20
* **ZK Verification Requests = 35:** LINK Spent ≈ 0.24
* **ZK Verification Requests = 36:** LINK Spent ≈ 0.24
* **ZK Verification Requests = 38:** LINK Spent ≈ 0.20
* **ZK Verification Requests = 39:** LINK Spent ≈ 0.24
* **ZK Verification Requests = 40:** LINK Spent ≈ 0.20
### Key Observations
* The LINK token spent is relatively stable around 0.24 for the first 17 ZK Verification Requests, with some dips to 0.20.
* There are two significant spikes in LINK token spent at 22 and 25 ZK Verification Requests, reaching approximately 0.41.
* After the spikes, the LINK token spent returns to a lower level, fluctuating around 0.20 to 0.25 for the remaining ZK Verification Requests.
### Interpretation
The chart suggests that there are specific instances around 22 and 25 ZK Verification Requests where the LINK token consumption is significantly higher than usual. This could be due to more complex or resource-intensive verification processes during those requests. The relatively stable LINK spending for other verification requests indicates a consistent cost for standard verifications. The spikes could be indicative of anomalies or specific types of verification requests that require more LINK tokens.