\n
## Line Chart: LINK Token Spent vs. Number of ZK Verification Requests
### Overview
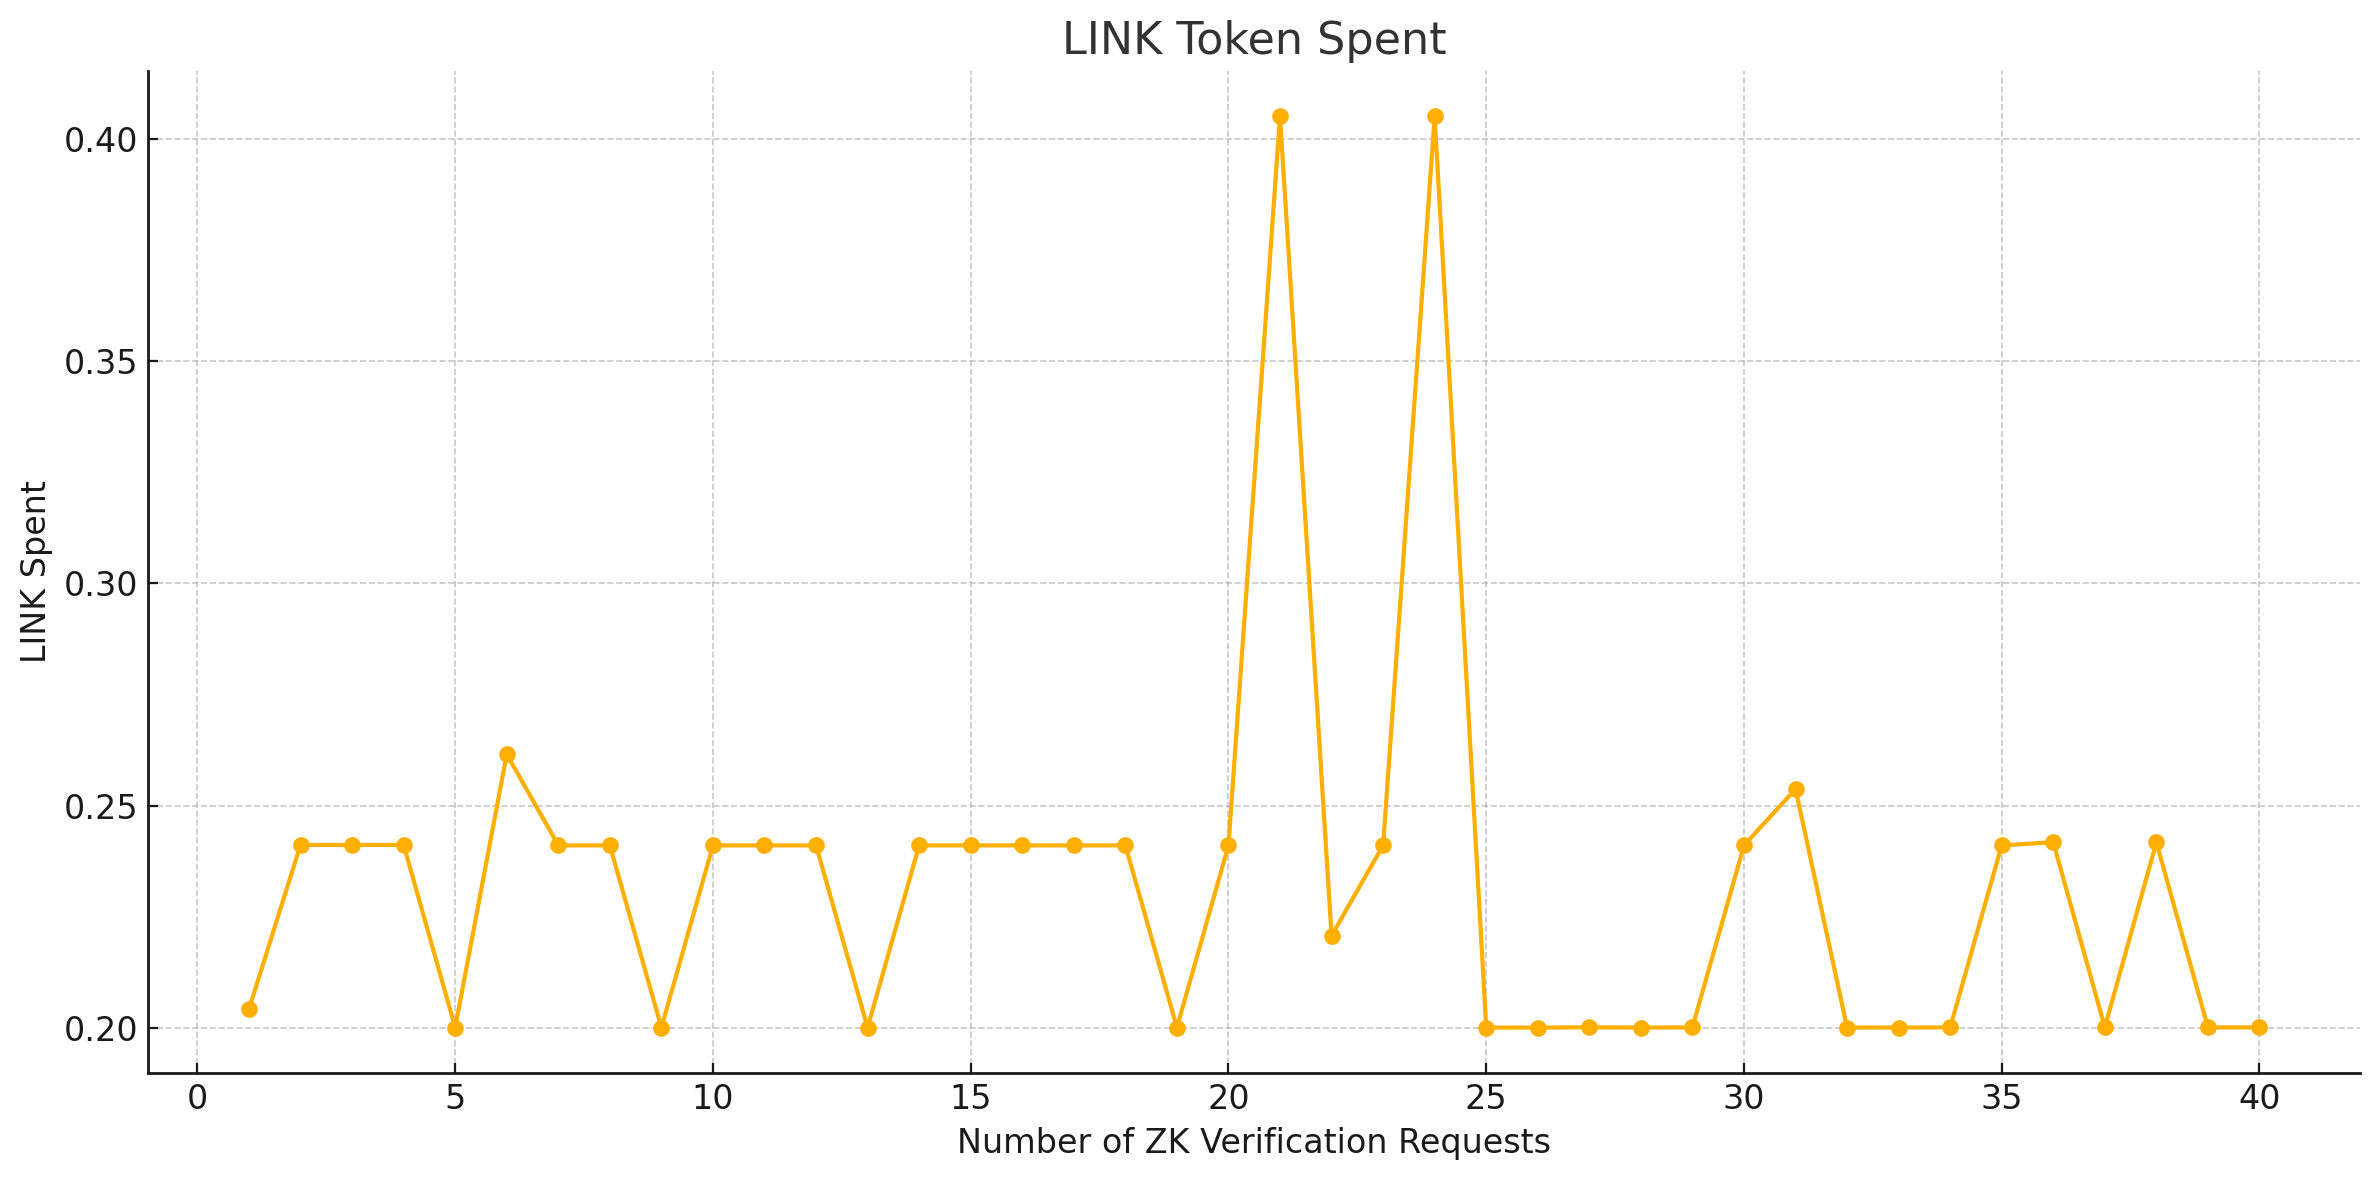
The image presents a line chart illustrating the relationship between the number of Zero-Knowledge (ZK) Verification Requests and the amount of LINK token spent. The chart displays a single data series represented by an orange line against a grid background.
### Components/Axes
* **Title:** "LINK Token Spent" - positioned at the top-center of the chart.
* **X-axis:** "Number of ZK Verification Requests" - ranging from 0 to 40, with tick marks at integer values.
* **Y-axis:** "LINK Spent" - ranging from 0.20 to 0.42, with tick marks at 0.20, 0.25, 0.30, 0.35, and 0.40.
* **Data Series:** A single orange line representing the LINK token spent for a given number of ZK verification requests.
* **Grid:** A light gray grid is present in the background to aid in reading values.
### Detailed Analysis
The orange line exhibits a fluctuating pattern. Let's analyze the data points:
* At 0 ZK Verification Requests, approximately 0.22 LINK is spent.
* At 5 ZK Verification Requests, approximately 0.26 LINK is spent.
* At 10 ZK Verification Requests, approximately 0.23 LINK is spent.
* At 15 ZK Verification Requests, approximately 0.24 LINK is spent.
* At 20 ZK Verification Requests, there is a significant peak, with approximately 0.41 LINK spent.
* At 25 ZK Verification Requests, the value drops to approximately 0.21 LINK.
* At 30 ZK Verification Requests, approximately 0.25 LINK is spent.
* At 35 ZK Verification Requests, approximately 0.24 LINK is spent.
* At 40 ZK Verification Requests, approximately 0.20 LINK is spent.
The line generally oscillates between approximately 0.21 and 0.26 LINK spent, with a notable outlier at 20 ZK Verification Requests. The trend is not consistently upward or downward, but rather cyclical with a large spike.
### Key Observations
* **Outlier:** The most significant observation is the peak at 20 ZK Verification Requests, where LINK spent is substantially higher than at any other point.
* **Fluctuation:** The amount of LINK spent fluctuates with the number of ZK verification requests, but the relationship is not linear.
* **Low End:** The lowest values are observed around 25 and 40 ZK Verification Requests.
### Interpretation
The chart suggests that the cost of ZK verification requests, measured in LINK tokens, is generally consistent but can experience significant spikes under certain conditions. The outlier at 20 ZK Verification Requests indicates that a specific number of requests or a particular type of request may be considerably more expensive. This could be due to increased computational complexity, higher gas fees, or other factors influencing the cost of ZK verification.
The cyclical nature of the data suggests that there might be a pattern related to the type or batching of ZK verification requests. Further investigation would be needed to determine the cause of these fluctuations and the reason for the outlier. The data implies that the cost of ZK verification is not predictable and can vary significantly, which is important for users and developers utilizing these services. The chart provides a visual representation of the economic cost associated with ZK verification, which is crucial for understanding the overall efficiency and scalability of the system.