## Line Graph: LINK Token Spent
### Overview
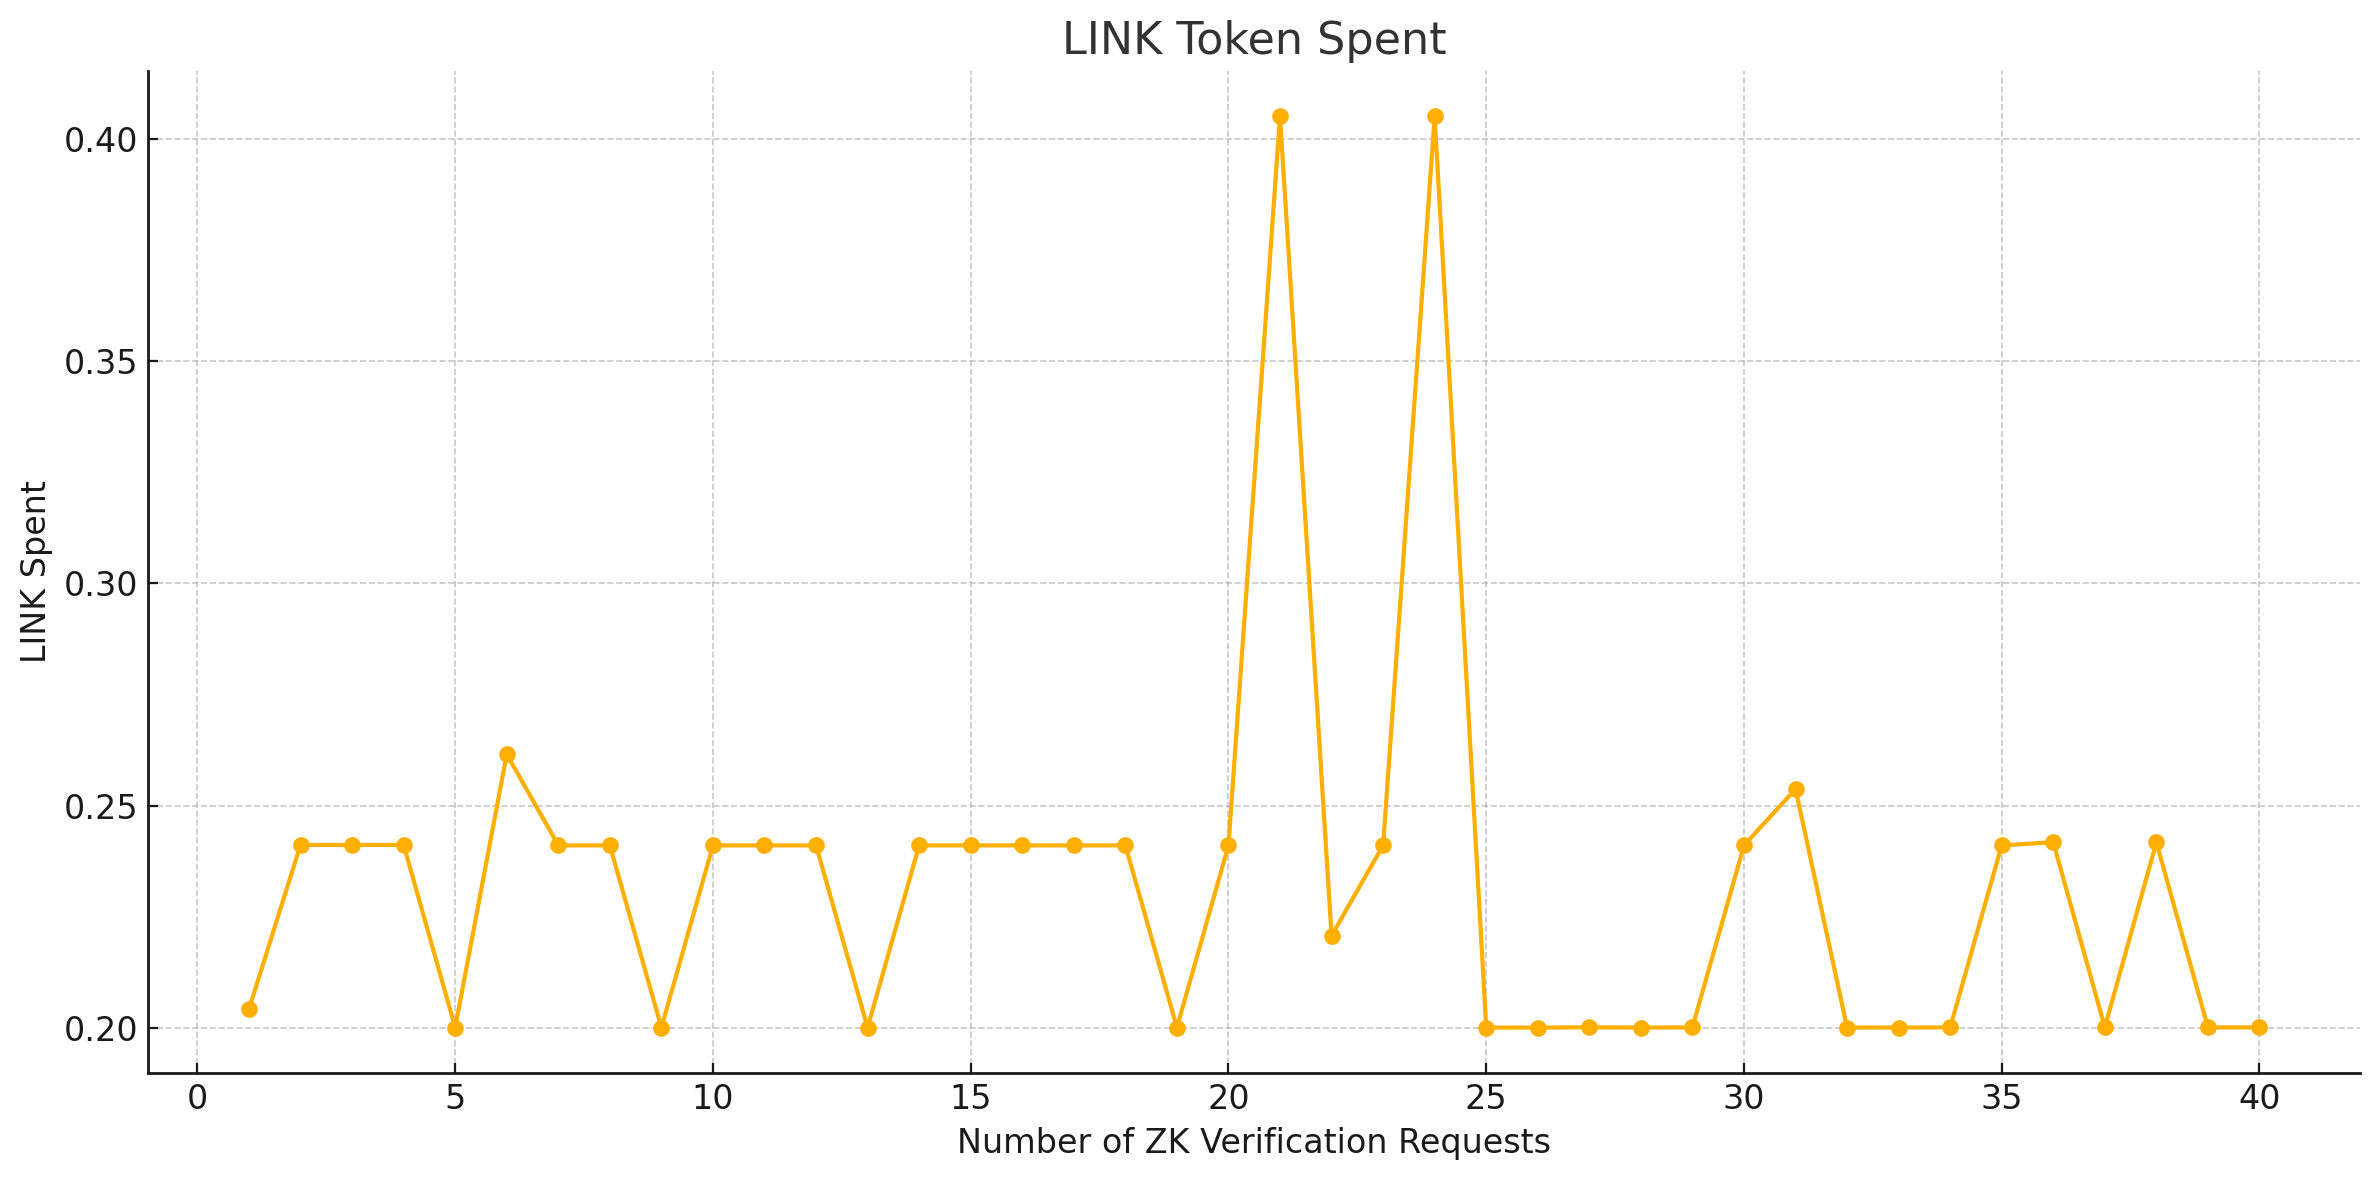
The image depicts a line graph titled "LINK Token Spent," illustrating the relationship between the number of ZK Verification Requests (x-axis) and the amount of LINK tokens spent (y-axis). The graph shows a fluctuating pattern with notable peaks, dips, and flat regions.
### Components/Axes
- **Title**: "LINK Token Spent" (centered at the top).
- **X-Axis**: "Number of ZK Verification Requests" (horizontal axis, labeled at the bottom). Scale ranges from 0 to 40 in increments of 5.
- **Y-Axis**: "LINK Token Spent" (vertical axis, labeled on the left). Scale ranges from 0.20 to 0.40 in increments of 0.05.
- **Legend**: Not visible in the image.
- **Data Line**: Orange line with circular data points (color matches the legend description).
### Detailed Analysis
- **X-Axis Labels**: Ticks at 0, 5, 10, 15, 20, 25, 30, 35, 40.
- **Y-Axis Labels**: Ticks at 0.20, 0.25, 0.30, 0.35, 0.40.
- **Data Points**:
- **0**: 0.20
- **1–4**: 0.24 (flat)
- **5**: 0.20
- **6**: 0.26
- **7–9**: 0.24 (flat)
- **10–13**: 0.24 (flat)
- **14**: 0.24
- **15–19**: 0.24 (flat)
- **20**: 0.40 (peak)
- **21**: 0.22 (dip)
- **22–24**: 0.40 (peak)
- **25–29**: 0.20 (flat)
- **30**: 0.24
- **31–32**: 0.20 (flat)
- **33–34**: 0.20 (flat)
- **35–36**: 0.24 (peak)
- **37–38**: 0.24 (flat)
- **39–40**: 0.20 (flat)
### Key Observations
1. **Peaks**:
- Two sharp spikes at x=20 and x=24, both reaching 0.40 LINK tokens spent.
- A smaller peak at x=36–37, reaching 0.24 LINK tokens spent.
2. **Dips**:
- A notable dip at x=21 (0.22 LINK tokens spent).
- Flat regions at 0.20 LINK tokens spent (x=25–29, 33–34, 39–40).
3. **Flat Regions**:
- Multiple flat segments (e.g., x=1–4, 7–9, 10–13, 15–19) indicate stable token spending despite varying verification requests.
4. **Trends**:
- The line oscillates between 0.20 and 0.40, with the highest values concentrated around x=20–24 and x=36–37.
### Interpretation
- **High Spending Correlation**: The spikes at x=20 and x=24 suggest a direct relationship between ZK Verification Requests and LINK token expenditure. This could indicate increased computational costs or system inefficiencies during these intervals.
- **Stable Spending**: Flat regions (e.g., x=25–29) imply that token spending remains constant despite fluctuations in verification requests, possibly due to optimized processes or capped resource allocation.
- **Anomalies**: The dip at x=21 (0.22) contradicts the general upward trend, potentially signaling a temporary system adjustment or error.
- **Final Dip**: The drop to 0.20 at x=39–40 may reflect reduced activity or a system reset.
### Spatial Grounding
- The title is centered at the top, with axes labeled on the left (y-axis) and bottom (x-axis). The orange line dominates the center, with data points evenly spaced along the x-axis.
### Conclusion
The graph highlights cyclical patterns in LINK token spending, with peaks likely tied to specific verification request thresholds. Further investigation into the causes of spikes (e.g., system bottlenecks) and flat regions (e.g., efficiency gains) could optimize resource allocation.