## Scatter Plots: Model Accuracy vs. Cost
### Overview
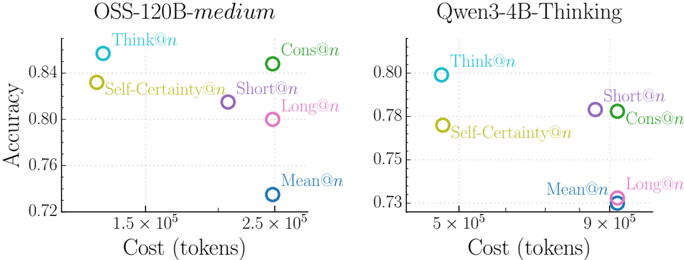
The image contains two scatter plots comparing the accuracy and cost (in tokens) of different models. The left plot is for "OSS-120B-medium" and the right plot is for "Qwen3-4B-Thinking". Each data point represents a different configuration or method, labeled as "Think@n", "Self-Certainty@n", "Cons@n", "Short@n", "Long@n", and "Mean@n".
### Components/Axes
* **Titles:**
* Left Plot: "OSS-120B-medium"
* Right Plot: "Qwen3-4B-Thinking"
* **X-axis (Cost):**
* Label: "Cost (tokens)"
* Left Plot: Scale ranges from approximately 1.0 x 10^5 to 3.0 x 10^5. Markers at 1.5 x 10^5 and 2.5 x 10^5.
* Right Plot: Scale ranges from approximately 4.0 x 10^5 to 10.0 x 10^5. Markers at 5 x 10^5 and 9 x 10^5.
* **Y-axis (Accuracy):**
* Label: "Accuracy"
* Scale: Ranges from 0.72 to 0.84 on the left plot, and from 0.73 to 0.80 on the right plot. Markers at 0.72, 0.76, 0.80, and 0.84 (left) and 0.73, 0.75, 0.78, and 0.80 (right).
* **Data Points/Labels:**
* Think@n (Turquoise)
* Self-Certainty@n (Yellow-Green)
* Cons@n (Green)
* Short@n (Purple)
* Long@n (Pink)
* Mean@n (Blue)
### Detailed Analysis
**Left Plot (OSS-120B-medium):**
* **Think@n (Turquoise):** Accuracy ~0.85, Cost ~1.4 x 10^5.
* **Self-Certainty@n (Yellow-Green):** Accuracy ~0.84, Cost ~1.6 x 10^5.
* **Cons@n (Green):** Accuracy ~0.84, Cost ~2.4 x 10^5.
* **Short@n (Purple):** Accuracy ~0.81, Cost ~2.3 x 10^5.
* **Long@n (Pink):** Accuracy ~0.80, Cost ~2.5 x 10^5.
* **Mean@n (Blue):** Accuracy ~0.73, Cost ~2.5 x 10^5.
**Right Plot (Qwen3-4B-Thinking):**
* **Think@n (Turquoise):** Accuracy ~0.80, Cost ~4.8 x 10^5.
* **Self-Certainty@n (Yellow-Green):** Accuracy ~0.77, Cost ~5.0 x 10^5.
* **Short@n (Purple):** Accuracy ~0.79, Cost ~8.8 x 10^5.
* **Cons@n (Green):** Accuracy ~0.79, Cost ~9.0 x 10^5.
* **Long@n (Pink):** Accuracy ~0.73, Cost ~9.2 x 10^5.
* **Mean@n (Blue):** Accuracy ~0.73, Cost ~9.1 x 10^5.
### Key Observations
* For both models, "Think@n" achieves relatively high accuracy at a lower cost compared to other methods.
* "Mean@n" consistently shows the lowest accuracy for both models.
* The cost range for "Qwen3-4B-Thinking" is significantly higher than "OSS-120B-medium".
* The accuracy range for "OSS-120B-medium" is slightly wider than "Qwen3-4B-Thinking".
### Interpretation
The scatter plots illustrate the trade-off between accuracy and cost for different methods applied to two different models. The data suggests that "Think@n" is a more efficient approach, providing a good balance between accuracy and cost. The higher cost associated with "Qwen3-4B-Thinking" compared to "OSS-120B-medium" indicates that it may be a more resource-intensive model. The relatively low accuracy of "Mean@n" suggests that this method may not be as effective for these models. The clustering of "Long@n" and "Mean@n" at the bottom-right of the "Qwen3-4B-Thinking" plot indicates that these methods are both costly and less accurate for this model.