\n
## Scatter Plot Comparison: Cost vs. Accuracy for Different Inference Methods
### Overview
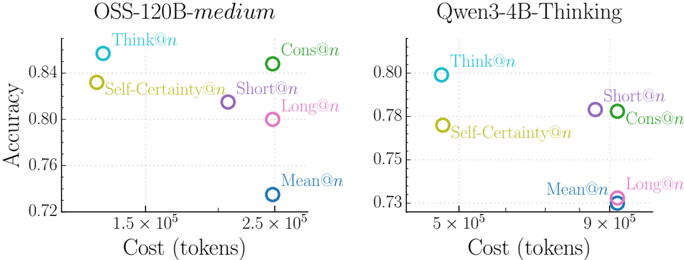
The image displays two side-by-side scatter plots comparing the trade-off between computational cost (measured in tokens) and accuracy for different inference or reasoning methods applied to two distinct language models. The left chart is for a model labeled "OSS-120B-medium," and the right chart is for "Qwen3-4B-Thinking." Each data point represents a specific method, identified by a colored circle and a text label.
### Components/Axes
**Common Elements:**
* **X-axis:** Labeled "Cost (tokens)". The scale is logarithmic, with major tick marks at powers of 10 (e.g., 1.5 x 10⁵, 2.5 x 10⁵, 5 x 10⁵, 9 x 10⁵).
* **Y-axis:** Labeled "Accuracy". The scale is linear, ranging from approximately 0.72 to 0.86 on the left chart and 0.73 to 0.80 on the right chart.
* **Data Series (Legend):** Six methods are compared, each with a distinct color and label placed directly next to its data point. The methods are:
1. `Think@n` (Cyan circle)
2. `Self-Certainty@n` (Yellow circle)
3. `Cons@n` (Green circle)
4. `Short@n` (Purple circle)
5. `Long@n` (Pink circle)
6. `Mean@n` (Blue circle)
**Left Chart: OSS-120B-medium**
* **Title:** "OSS-120B-medium" (centered above the plot).
* **X-axis Range:** Approximately 1.0 x 10⁵ to 3.0 x 10⁵ tokens.
* **Y-axis Range:** 0.72 to 0.86.
**Right Chart: Qwen3-4B-Thinking**
* **Title:** "Qwen3-4B-Thinking" (centered above the plot).
* **X-axis Range:** Approximately 4.0 x 10⁵ to 1.0 x 10⁶ tokens.
* **Y-axis Range:** 0.73 to 0.80.
### Detailed Analysis
**OSS-120B-medium (Left Chart) Data Points (Approximate Values):**
* **`Think@n` (Cyan):** Positioned at the top-left. Cost ≈ 1.3 x 10⁵ tokens, Accuracy ≈ 0.85. This is the highest accuracy and lowest cost method for this model.
* **`Self-Certainty@n` (Yellow):** Positioned below `Think@n`. Cost ≈ 1.3 x 10⁵ tokens, Accuracy ≈ 0.83.
* **`Cons@n` (Green):** Positioned at the top-right. Cost ≈ 2.5 x 10⁵ tokens, Accuracy ≈ 0.84. Similar accuracy to `Think@n` but at nearly double the cost.
* **`Short@n` (Purple):** Positioned in the middle. Cost ≈ 2.0 x 10⁵ tokens, Accuracy ≈ 0.81.
* **`Long@n` (Pink):** Positioned slightly below and to the right of `Short@n`. Cost ≈ 2.5 x 10⁵ tokens, Accuracy ≈ 0.80.
* **`Mean@n` (Blue):** Positioned at the bottom-right. Cost ≈ 2.5 x 10⁵ tokens, Accuracy ≈ 0.73. This is the lowest accuracy method and shares the highest cost with `Cons@n` and `Long@n`.
**Qwen3-4B-Thinking (Right Chart) Data Points (Approximate Values):**
* **`Think@n` (Cyan):** Positioned at the top-left. Cost ≈ 5.0 x 10⁵ tokens, Accuracy ≈ 0.80. Again, the highest accuracy and lowest cost method.
* **`Self-Certainty@n` (Yellow):** Positioned below `Think@n`. Cost ≈ 5.0 x 10⁵ tokens, Accuracy ≈ 0.77.
* **`Cons@n` (Green):** Positioned in the middle-right. Cost ≈ 9.0 x 10⁵ tokens, Accuracy ≈ 0.78.
* **`Short@n` (Purple):** Positioned very close to `Cons@n`, slightly to its left. Cost ≈ 8.5 x 10⁵ tokens, Accuracy ≈ 0.78.
* **`Long@n` (Pink):** Positioned at the bottom-right. Cost ≈ 9.0 x 10⁵ tokens, Accuracy ≈ 0.73.
* **`Mean@n` (Blue):** Positioned at the bottom-right, overlapping with `Long@n`. Cost ≈ 9.0 x 10⁵ tokens, Accuracy ≈ 0.73.
### Key Observations
1. **Consistent Hierarchy:** In both models, the `Think@n` method achieves the highest accuracy at the lowest token cost. The `Mean@n` method consistently yields the lowest accuracy at a high token cost.
2. **Cost-Accuracy Trade-off:** There is a general, but not strict, inverse relationship between cost and accuracy. The most accurate methods (`Think@n`, `Cons@n`) are not the most expensive, while the least accurate (`Mean@n`) is among the most expensive.
3. **Model Scale Difference:** The OSS-120B-medium model operates at a lower token cost range (10⁵) and achieves higher overall accuracy (up to ~0.85) compared to the Qwen3-4B-Thinking model (cost range 10⁵-10⁶, max accuracy ~0.80).
4. **Clustering:** In the Qwen3-4B-Thinking chart, `Short@n`, `Cons@n`, `Long@n`, and `Mean@n` form a cluster at the high-cost end (8.5-9.0 x 10⁵ tokens), but with a wide spread in accuracy (0.73 to 0.78).
### Interpretation
This visualization analyzes the efficiency of different reasoning or inference strategies ("@n" methods) for two language models of different scales. The data suggests that the **`Think@n` strategy is the most efficient** for both models, providing the best accuracy per token spent. This could imply that a specific form of internal "thinking" or chain-of-thought processing is highly effective.
Conversely, the **`Mean@n` strategy appears to be the least efficient**, consuming significant computational resources for minimal accuracy gain. This might represent a naive averaging or aggregation method that introduces noise.
The significant difference in cost scales between the two models (OSS-120B-medium at ~10⁵ tokens vs. Qwen3-4B-Thinking at ~10⁶ tokens) for similar tasks highlights the **impact of model architecture and size on computational efficiency**. The larger OSS model achieves better results with fewer tokens.
The clustering of several methods at the high-cost end for the smaller Qwen model suggests a **performance ceiling or saturation point** where simply spending more tokens (via methods like `Long@n` or `Cons@n`) does not proportionally improve accuracy, and can even degrade it compared to the optimal `Think@n` approach. This underscores the importance of choosing the right inference strategy, not just scaling compute.