## Scatter Plots: Model Performance vs. Computational Cost
### Overview
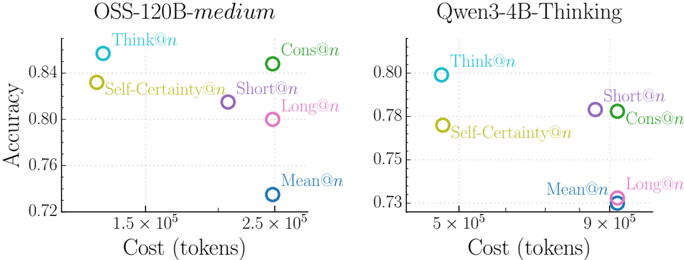
The image contains two side-by-side scatter plots comparing model performance metrics (accuracy) against computational cost (tokens) for two language models: **OSS-120B-medium** (left) and **Qwen3-4B-Thinking** (right). Each plot uses color-coded data points to represent different evaluation strategies, with accuracy on the y-axis (0.72–0.84) and cost on the x-axis (1.5×10⁵–9×10⁵ tokens).
---
### Components/Axes
- **Left Chart (OSS-120B-medium)**:
- **X-axis**: Cost (tokens) ranging from 1.5×10⁵ to 2.5×10⁵.
- **Y-axis**: Accuracy ranging from 0.72 to 0.84.
- **Legend**: Positioned at the top, with labels and colors:
- **Think@n** (blue)
- **Self-Certainty@n** (yellow)
- **Cons@n** (green)
- **Short@n** (purple)
- **Long@n** (pink)
- **Mean@n** (dark blue)
- **Data Points**: Six labeled points with approximate coordinates:
- **Think@n**: (1.5×10⁵, 0.84)
- **Self-Certainty@n**: (1.8×10⁵, 0.83)
- **Cons@n**: (2.2×10⁵, 0.82)
- **Short@n**: (2.0×10⁵, 0.81)
- **Long@n**: (2.3×10⁵, 0.79)
- **Mean@n**: (2.5×10⁵, 0.73)
- **Right Chart (Qwen3-4B-Thinking)**:
- **X-axis**: Cost (tokens) ranging from 5×10⁵ to 9×10⁵.
- **Y-axis**: Accuracy ranging from 0.73 to 0.80.
- **Legend**: Positioned at the top, with labels and colors:
- **Think@n** (blue)
- **Self-Certainty@n** (yellow)
- **Cons@n** (green)
- **Short@n** (purple)
- **Long@n** (pink)
- **Mean@n** (dark blue)
- **Data Points**: Six labeled points with approximate coordinates:
- **Think@n**: (5.5×10⁵, 0.79)
- **Self-Certainty@n**: (6.0×10⁵, 0.78)
- **Cons@n**: (7.0×10⁵, 0.77)
- **Short@n**: (6.5×10⁵, 0.76)
- **Long@n**: (8.5×10⁵, 0.74)
- **Mean@n**: (9.0×10⁵, 0.73)
---
### Detailed Analysis
#### Left Chart (OSS-120B-medium)
- **Trends**:
- **Think@n** achieves the highest accuracy (0.84) at the lowest cost (1.5×10⁵ tokens).
- **Self-Certainty@n** and **Cons@n** show moderate accuracy (0.83–0.82) with slightly higher costs (1.8–2.2×10⁵ tokens).
- **Short@n** and **Long@n** exhibit lower accuracy (0.81–0.79) at higher costs (2.0–2.3×10⁵ tokens).
- **Mean@n** has the lowest accuracy (0.73) and highest cost (2.5×10⁵ tokens).
#### Right Chart (Qwen3-4B-Thinking)
- **Trends**:
- **Think@n** again leads with the highest accuracy (0.79) at 5.5×10⁵ tokens.
- **Self-Certainty@n** and **Cons@n** follow with accuracy (0.78–0.77) at 6.0–7.0×10⁵ tokens.
- **Short@n** and **Long@n** show declining accuracy (0.76–0.74) at higher costs (6.5–8.5×10⁵ tokens).
- **Mean@n** has the lowest accuracy (0.73) and highest cost (9.0×10⁵ tokens).
---
### Key Observations
1. **Model-Specific Performance**:
- **OSS-120B-medium** outperforms **Qwen3-4B-Thinking** in accuracy across all strategies, despite similar computational costs.
- **Mean@n** consistently underperforms in both models, suggesting it may be a baseline or inefficient strategy.
2. **Cost-Accuracy Tradeoff**:
- Higher accuracy correlates with lower computational cost in both models (e.g., **Think@n** vs. **Mean@n**).
- **Long@n** and **Short@n** strategies show diminishing returns, requiring more tokens for marginal accuracy gains.
3. **Outliers**:
- **Mean@n** in both charts is an outlier, with the lowest accuracy and highest cost, indicating potential inefficiency.
---
### Interpretation
The data highlights a tradeoff between accuracy and computational efficiency across evaluation strategies. **Think@n** emerges as the most cost-effective method for both models, achieving high accuracy with minimal token usage. In contrast, **Mean@n** is consistently inefficient, suggesting it may represent a naive or suboptimal approach. The **OSS-120B-medium** model demonstrates superior performance overall, while **Qwen3-4B-Thinking** lags in accuracy but follows similar cost patterns. These results could inform resource allocation decisions in model deployment, prioritizing strategies like **Think@n** for optimal performance.