## Line Chart: Mean Pass Rate vs. Mean Number of Tokens Generated
### Overview
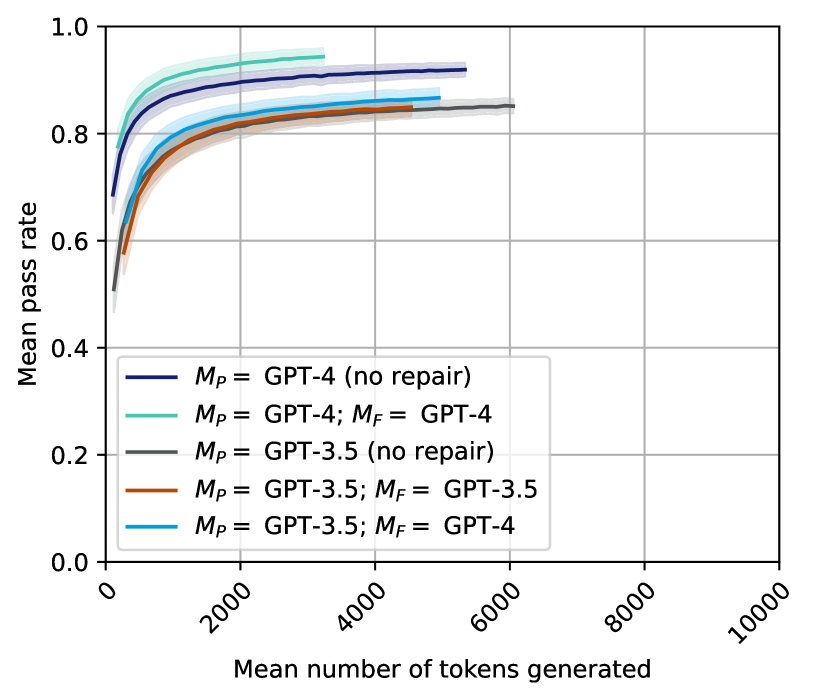
The image is a line chart comparing the mean pass rate of different GPT models against the mean number of tokens generated. The chart displays five different configurations of GPT models, with shaded regions around each line indicating variability. The x-axis represents the mean number of tokens generated, ranging from 0 to 10,000. The y-axis represents the mean pass rate, ranging from 0.0 to 1.0.
### Components/Axes
* **X-axis:** Mean number of tokens generated, ranging from 0 to 10000, with tick marks at 0, 2000, 4000, 6000, 8000, and 10000.
* **Y-axis:** Mean pass rate, ranging from 0.0 to 1.0, with tick marks at 0.0, 0.2, 0.4, 0.6, 0.8, and 1.0.
* **Legend:** Located in the center-left of the chart, it identifies the five different GPT model configurations:
* Dark Blue: *M<sub>P</sub>* = GPT-4 (no repair)
* Teal: *M<sub>P</sub>* = GPT-4; *M<sub>F</sub>* = GPT-4
* Gray: *M<sub>P</sub>* = GPT-3.5 (no repair)
* Brown: *M<sub>P</sub>* = GPT-3.5; *M<sub>F</sub>* = GPT-3.5
* Light Blue: *M<sub>P</sub>* = GPT-3.5; *M<sub>F</sub>* = GPT-4
### Detailed Analysis
* **Dark Blue Line:** *M<sub>P</sub>* = GPT-4 (no repair). This line starts at approximately 0.52 pass rate at 0 tokens and quickly rises to approximately 0.85 by 1000 tokens. It continues to increase, reaching approximately 0.92 around 6000 tokens, where it plateaus.
* **Teal Line:** *M<sub>P</sub>* = GPT-4; *M<sub>F</sub>* = GPT-4. This line starts at approximately 0.60 pass rate at 0 tokens and rises to approximately 0.88 by 1000 tokens. It plateaus around 0.94 after 4000 tokens.
* **Gray Line:** *M<sub>P</sub>* = GPT-3.5 (no repair). This line starts at approximately 0.50 pass rate at 0 tokens and rises to approximately 0.80 by 2000 tokens. It plateaus around 0.85 after 6000 tokens.
* **Brown Line:** *M<sub>P</sub>* = GPT-3.5; *M<sub>F</sub>* = GPT-3.5. This line starts at approximately 0.58 pass rate at 0 tokens and rises to approximately 0.78 by 1000 tokens. It plateaus around 0.84 after 4000 tokens.
* **Light Blue Line:** *M<sub>P</sub>* = GPT-3.5; *M<sub>F</sub>* = GPT-4. This line starts at approximately 0.58 pass rate at 0 tokens and rises to approximately 0.82 by 1000 tokens. It plateaus around 0.86 after 4000 tokens.
### Key Observations
* All lines show a rapid increase in the mean pass rate with an increasing number of tokens generated, especially in the initial 2000 tokens.
* The GPT-4 models (dark blue and teal lines) generally outperform the GPT-3.5 models (gray, brown, and light blue lines).
* The "no repair" GPT-4 model (dark blue line) performs slightly worse than the GPT-4 model with repair (teal line).
* Among the GPT-3.5 models, using GPT-4 for repair (*M<sub>F</sub>* = GPT-4, light blue line) results in a higher pass rate than using GPT-3.5 for repair (*M<sub>F</sub>* = GPT-3.5, brown line).
* The "no repair" GPT-3.5 model (gray line) performs slightly worse than the GPT-3.5 model with GPT-4 repair (light blue line).
### Interpretation
The chart demonstrates the relationship between the number of tokens generated and the mean pass rate for different GPT model configurations. The data suggests that:
1. **Model Version Matters:** GPT-4 models generally achieve higher pass rates than GPT-3.5 models, indicating a performance improvement in the newer model.
2. **Repair Mechanisms Improve Performance:** Using a repair mechanism (indicated by *M<sub>F</sub>*) improves the pass rate compared to using no repair.
3. **Using a Stronger Model for Repair is Beneficial:** When using GPT-3.5, employing GPT-4 for the repair mechanism leads to a higher pass rate than using GPT-3.5 for repair.
4. **Diminishing Returns:** The rapid increase in pass rate slows down as the number of tokens generated increases, suggesting diminishing returns in performance beyond a certain number of tokens.
The shaded regions around each line likely represent the standard deviation or confidence interval, indicating the variability in the pass rate for each model configuration. The consistent trends across all configurations suggest that the observed differences are statistically significant.