## Line Chart: Mean Pass Rate vs. Mean Number of Tokens Generated
### Overview
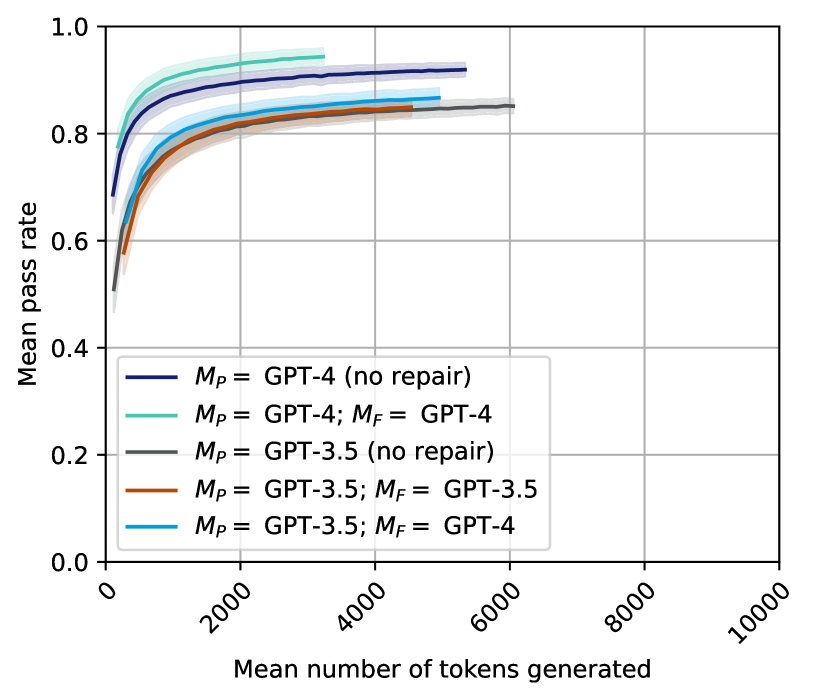
This is a line chart comparing the performance of different Large Language Model (LLM) configurations. The chart plots the "Mean pass rate" (y-axis) against the "Mean number of tokens generated" (x-axis) for five distinct model setups, showing how performance scales with increased token generation. The data suggests an evaluation of code generation or problem-solving tasks where "pass rate" is the success metric.
### Components/Axes
* **Chart Type:** Line chart with shaded confidence intervals or variance bands around each line.
* **X-Axis:**
* **Label:** "Mean number of tokens generated"
* **Scale:** Linear scale from 0 to 10,000.
* **Major Tick Marks:** 0, 2000, 4000, 6000, 8000, 10000.
* **Y-Axis:**
* **Label:** "Mean pass rate"
* **Scale:** Linear scale from 0.0 to 1.0.
* **Major Tick Marks:** 0.0, 0.2, 0.4, 0.6, 0.8, 1.0.
* **Legend:** Located in the bottom-left quadrant of the plot area. It contains five entries, each associating a colored line with a model configuration.
* **Dark Blue Line:** `M_P = GPT-4 (no repair)`
* **Teal Line:** `M_P = GPT-4; M_F = GPT-4`
* **Gray Line:** `M_P = GPT-3.5 (no repair)`
* **Orange Line:** `M_P = GPT-3.5; M_F = GPT-3.5`
* **Light Blue Line:** `M_P = GPT-3.5; M_F = GPT-4`
* *Notation:* `M_P` likely denotes the primary model, and `M_F` denotes a model used for a "repair" or refinement step.
### Detailed Analysis
The chart displays five data series, each showing a logarithmic-like growth trend where the mean pass rate increases rapidly with initial token generation and then plateaus.
1. **`M_P = GPT-4 (no repair)` (Dark Blue Line):**
* **Trend:** Starts highest among all series and maintains the lead throughout. Shows a steep initial rise followed by a very gradual plateau.
* **Approximate Data Points:** Starts at ~0.7 pass rate for very low tokens. Reaches ~0.85 by 1000 tokens, ~0.9 by 2000 tokens, and plateaus near ~0.92 by 5000+ tokens.
2. **`M_P = GPT-4; M_F = GPT-4` (Teal Line):**
* **Trend:** Starts slightly below the dark blue line but follows a nearly parallel trajectory, consistently performing second-best.
* **Approximate Data Points:** Starts at ~0.75. Reaches ~0.88 by 1000 tokens, ~0.92 by 2000 tokens, and plateaus near ~0.95 by 3000+ tokens.
3. **`M_P = GPT-3.5 (no repair)` (Gray Line):**
* **Trend:** Starts the lowest but shows significant improvement, converging with the orange line at higher token counts.
* **Approximate Data Points:** Starts at ~0.5. Reaches ~0.75 by 1000 tokens, ~0.82 by 2000 tokens, and plateaus near ~0.85 by 6000+ tokens.
4. **`M_P = GPT-3.5; M_F = GPT-3.5` (Orange Line):**
* **Trend:** Follows a path very similar to the gray line (`GPT-3.5 no repair`), often overlapping or sitting slightly below it.
* **Approximate Data Points:** Starts at ~0.55. Reaches ~0.78 by 1000 tokens, ~0.83 by 2000 tokens, and plateaus near ~0.85 by 4500+ tokens.
5. **`M_P = GPT-3.5; M_F = GPT-4` (Light Blue Line):**
* **Trend:** Starts higher than the other GPT-3.5 configurations but lower than the GPT-4 lines. It maintains a clear gap above the gray and orange lines.
* **Approximate Data Points:** Starts at ~0.6. Reaches ~0.82 by 1000 tokens, ~0.86 by 2000 tokens, and plateaus near ~0.88 by 5000+ tokens.
### Key Observations
1. **Performance Hierarchy:** A clear performance hierarchy is established: GPT-4 based configurations (dark blue, teal) significantly outperform all GPT-3.5 based configurations (gray, orange, light blue).
2. **Impact of Repair (`M_F`):**
* For GPT-4, adding a GPT-4 repair step (teal line) results in a slight but consistent performance *decrease* compared to no repair (dark blue line).
* For GPT-3.5, adding a same-model repair step (orange line) shows negligible difference from no repair (gray line).
* Using a stronger model (GPT-4) for repair on a GPT-3.5 primary model (light blue line) provides a clear performance boost over GPT-3.5 alone.
3. **Diminishing Returns:** All configurations exhibit strong diminishing returns. The majority of performance gain occurs within the first 2000 generated tokens. Beyond 4000-6000 tokens, the pass rate curves flatten considerably.
4. **Convergence:** The two GPT-3.5-only configurations (gray and orange) converge to nearly the same plateau (~0.85), suggesting a performance ceiling for that model in this task, regardless of a same-model repair step.
### Interpretation
This chart likely visualizes results from a study on iterative code generation or "self-repair" in LLMs. The data suggests several key insights:
* **Model Capability is Primary:** The base model's capability (`M_P`) is the dominant factor in performance. GPT-4's inherent superiority is evident across all token budgets.
* **Repair Dynamics are Nuanced:** The effect of a repair model (`M_F`) is not universally beneficial. Using the same powerful model (GPT-4) for both generation and repair may introduce redundancy or over-optimization, slightly harming performance. Conversely, using a stronger model to repair outputs from a weaker one (GPT-3.5 -> GPT-4) is an effective strategy to boost performance, acting as a "force multiplier."
* **Token Budget Efficiency:** The steep initial curves indicate that most problems solvable by these models are solved with relatively short solutions (under 2000 tokens). Generating beyond 6000 tokens yields minimal accuracy gains, suggesting a point where additional computation is inefficient for improving pass rate.
* **Performance Ceilings:** The plateauing of all lines indicates task-specific performance ceilings. GPT-3.5 appears to hit a ceiling around 85% pass rate, while GPT-4 approaches but does not reach 100%, suggesting some problems in the evaluation set are inherently difficult or unsolvable for these models within the given constraints.
**Language Note:** All text in the image is in English.