## Line Graph: Mean Pass Rate
### Overview
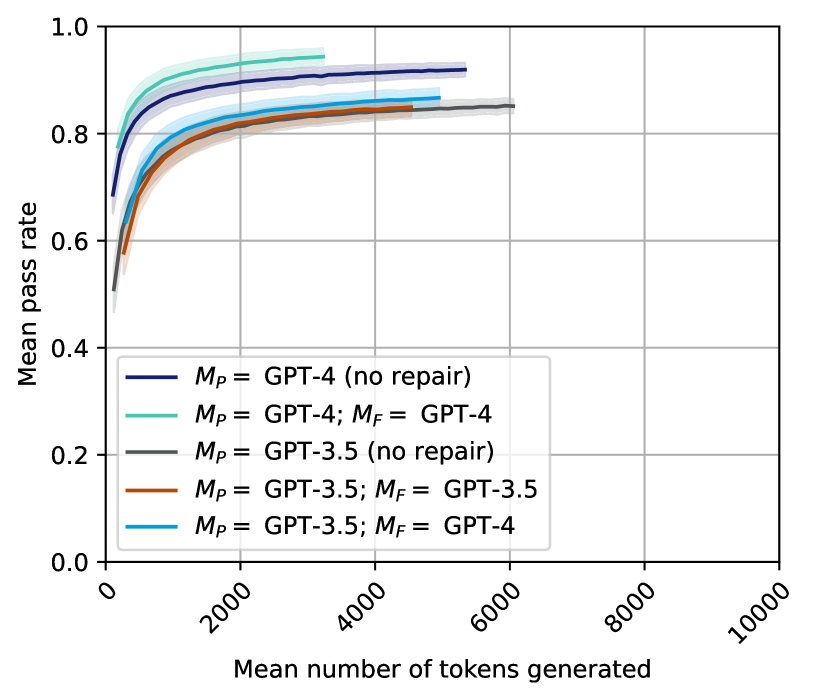
The line graph displays the mean pass rate of different models as a function of the mean number of tokens generated. The models compared are GPT-4, GPT-3.5, and their variants with and without repair.
### Components/Axes
- **X-axis**: Mean number of tokens generated, ranging from 0 to 10,000.
- **Y-axis**: Mean pass rate, ranging from 0.0 to 1.0.
- **Legend**: Located at the bottom right, indicating the models and their pass rates.
### Detailed Analysis or ### Content Details
- **GPT-4 (no repair)**: The line is the darkest blue, indicating the lowest mean pass rate.
- **GPT-4; M_F = GPT-4**: The line is a lighter blue, showing a higher mean pass rate compared to GPT-4 (no repair).
- **GPT-3.5 (no repair)**: The line is the lightest blue, indicating the highest mean pass rate among the models.
- **GPT-3.5; M_F = GPT-3.5**: The line is a darker shade of blue, showing a pass rate similar to GPT-3.5 (no repair).
- **GPT-3.5; M_F = GPT-4**: The line is the lightest blue, indicating the highest mean pass rate among the variants.
### Key Observations
- The pass rate increases with the mean number of tokens generated for all models.
- GPT-3.5 (no repair) consistently has the highest pass rate.
- The GPT-4 variant with repair (M_F = GPT-4) shows a significant improvement in pass rate compared to GPT-4 (no repair).
- The GPT-3.5 variant with repair (M_F = GPT-3.5) shows a slight improvement in pass rate compared to GPT-3.5 (no repair).
### Interpretation
The data suggests that the use of repair mechanisms in the GPT-4 model leads to a higher mean pass rate across different token counts. The GPT-3.5 model with repair also shows a slight improvement in pass rate compared to its variant without repair. This indicates that repair mechanisms can enhance the performance of language models, particularly in terms of pass rate.