\n
## Diagram: Event Relationship Network
### Overview
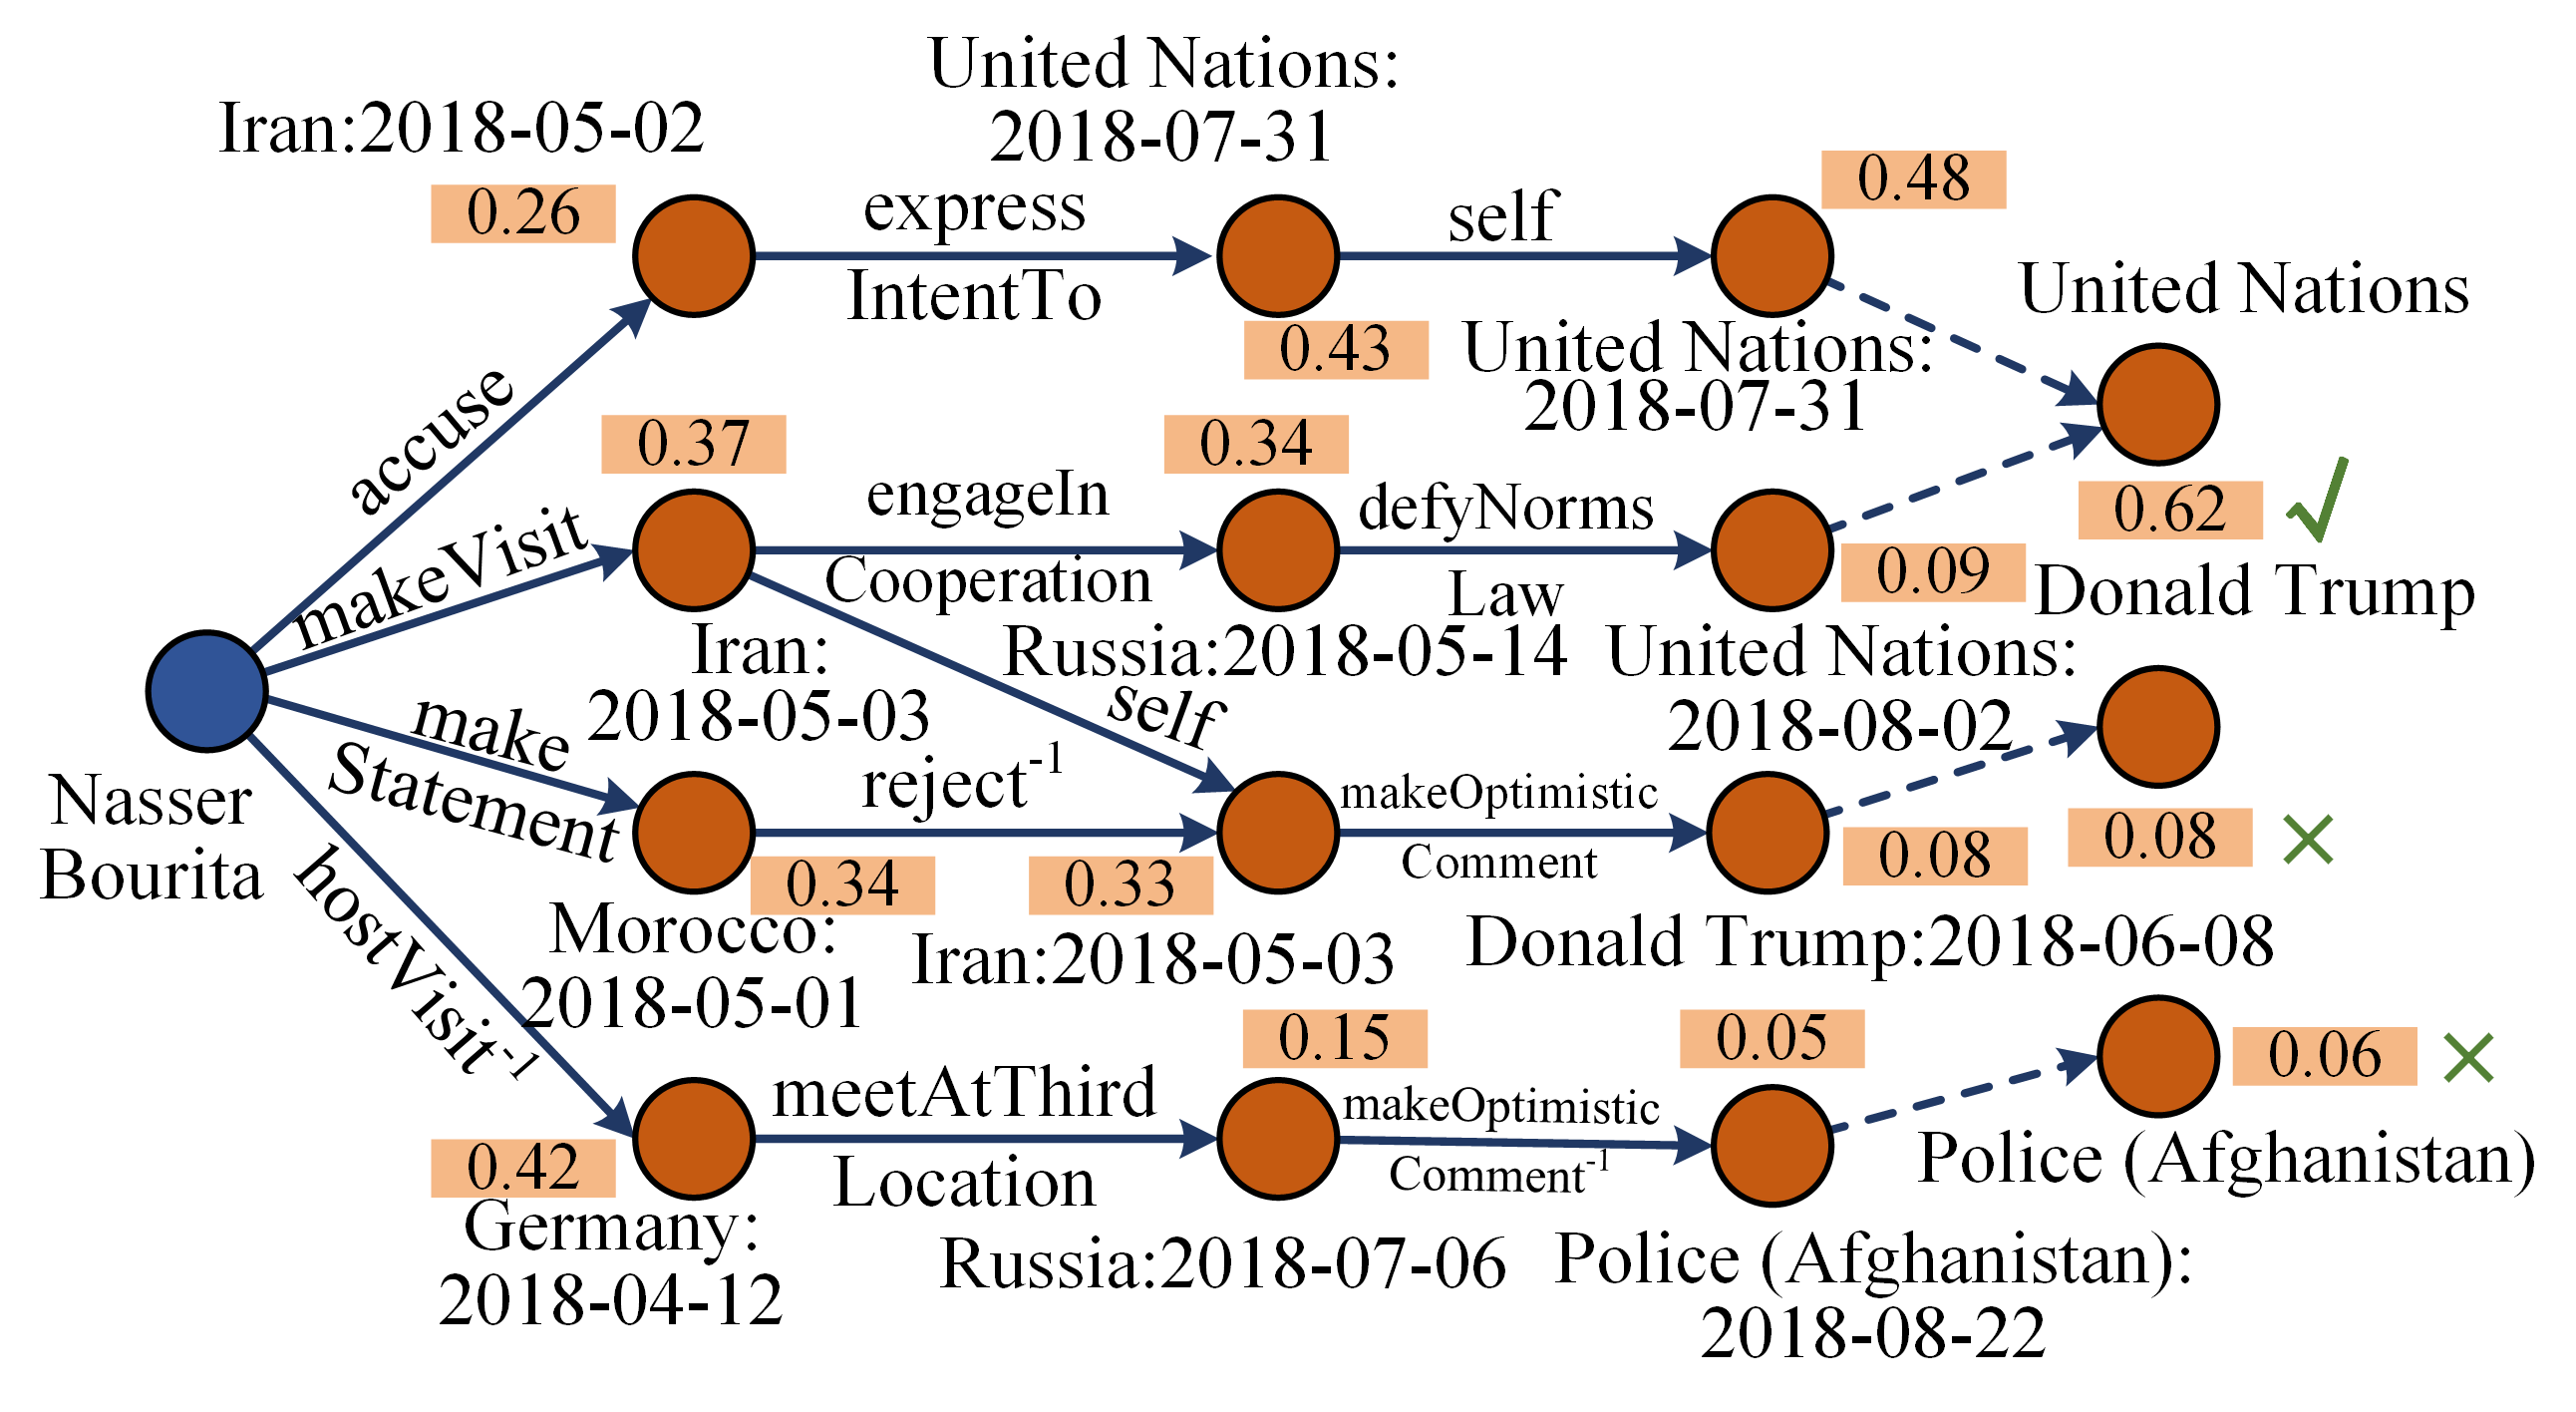
The image depicts a directed graph representing relationships between entities (people, organizations, locations) and events, along with associated probabilities. Nodes represent entities or events, and directed edges represent relationships between them, with numerical values indicating the strength or probability of the relationship. The diagram appears to model a sequence of events and interactions, potentially related to international relations or political events.
### Components/Axes
The diagram consists of nodes (circles) and directed edges (arrows). Each edge is labeled with a relationship type (e.g., "accuse", "makeVisit", "express") and a numerical value (between 0.05 and 0.62). Nodes are labeled with entity names and dates (e.g., "Iran:2018-05-02", "United Nations:2018-07-31", "Donald Trump:2018-06-08"). Some edges are solid lines, while others are dashed lines, and some nodes have checkmarks or crosses.
### Detailed Analysis or Content Details
The diagram can be broken down into several interconnected paths:
1. **Nasser Bourita -> Iran:2018-05-02:** Relationship "accuse" with a probability of 0.26.
2. **Iran:2018-05-02 -> United Nations:2018-07-31:** Relationship "express IntentTo" with a probability of 0.48.
3. **Iran:2018-05-02 -> Iran:2018-05-03:** Relationship "engageIn Cooperation" with a probability of 0.37.
4. **Iran:2018-05-03 -> Russia:2018-05-14:** Relationship "reject" with a probability of 0.33.
5. **Russia:2018-05-14 -> United Nations:2018-07-31:** Relationship "defyNorms Law" with a probability of 0.34.
6. **United Nations:2018-07-31 -> Donald Trump:** Dashed relationship with a probability of 0.62 and a checkmark.
7. **United Nations:2018-07-31 -> United Nations:2018-08-02:** Dashed relationship with a probability of 0.09.
8. **United Nations:2018-08-02 -> Donald Trump:2018-06-08:** Relationship "makeOptimistic Comment" with a probability of 0.08 and a cross.
9. **Donald Trump:2018-06-08 -> Police (Afghanistan):2018-08-22:** Dashed relationship "makeOptimistic Comment" with a probability of 0.05 and a cross.
10. **Police (Afghanistan):2018-08-22:** Probability of 0.06 and a cross.
11. **Morocco:2018-05-01 -> Iran:2018-05-03:** Relationship "make Statement" with a probability of 0.34.
12. **Germany:2018-04-12 -> Russia:2018-07-06:** Relationship "meetAtThird Location" with a probability of 0.42.
13. **Russia:2018-07-06 -> Police (Afghanistan):2018-08-22:** Relationship "makeOptimistic Comment" with a probability of 0.15.
The dashed lines indicate a different type of relationship or a weaker connection compared to the solid lines. The checkmarks and crosses likely represent positive or negative outcomes or validations of the relationships.
### Key Observations
* The United Nations appears to be a central node, connecting multiple entities and events.
* Relationships involving Donald Trump have lower probabilities and are marked with crosses, suggesting negative or unsuccessful outcomes.
* The path involving Morocco, Iran, and Russia seems to be a separate chain of events.
* The probabilities vary significantly, indicating varying degrees of confidence or strength in the relationships.
* The diagram shows a temporal aspect, with dates associated with each entity and event.
### Interpretation
The diagram likely represents a network of events and interactions, potentially related to political or diplomatic activities. The probabilities associated with each relationship suggest the likelihood or strength of the connection. The checkmarks and crosses indicate whether the relationships led to positive or negative outcomes. The diagram could be used to analyze the flow of information, identify key players, and assess the potential impact of different events.
The dashed lines and lower probabilities associated with Donald Trump suggest that interactions involving him may be less reliable or have unfavorable outcomes. The central role of the United Nations indicates its importance in mediating or influencing these events. The diagram provides a visual representation of complex relationships and allows for a more intuitive understanding of the dynamics at play. The use of dates suggests a chronological order of events, allowing for the reconstruction of a timeline. The diagram is a form of knowledge representation, encoding information about events, entities, and their relationships in a structured and visual format.